The examples below are taken from ggplot2 documentation and are
intended to demonstrate the effect of the theme_trace() and
scale_trace() functions.
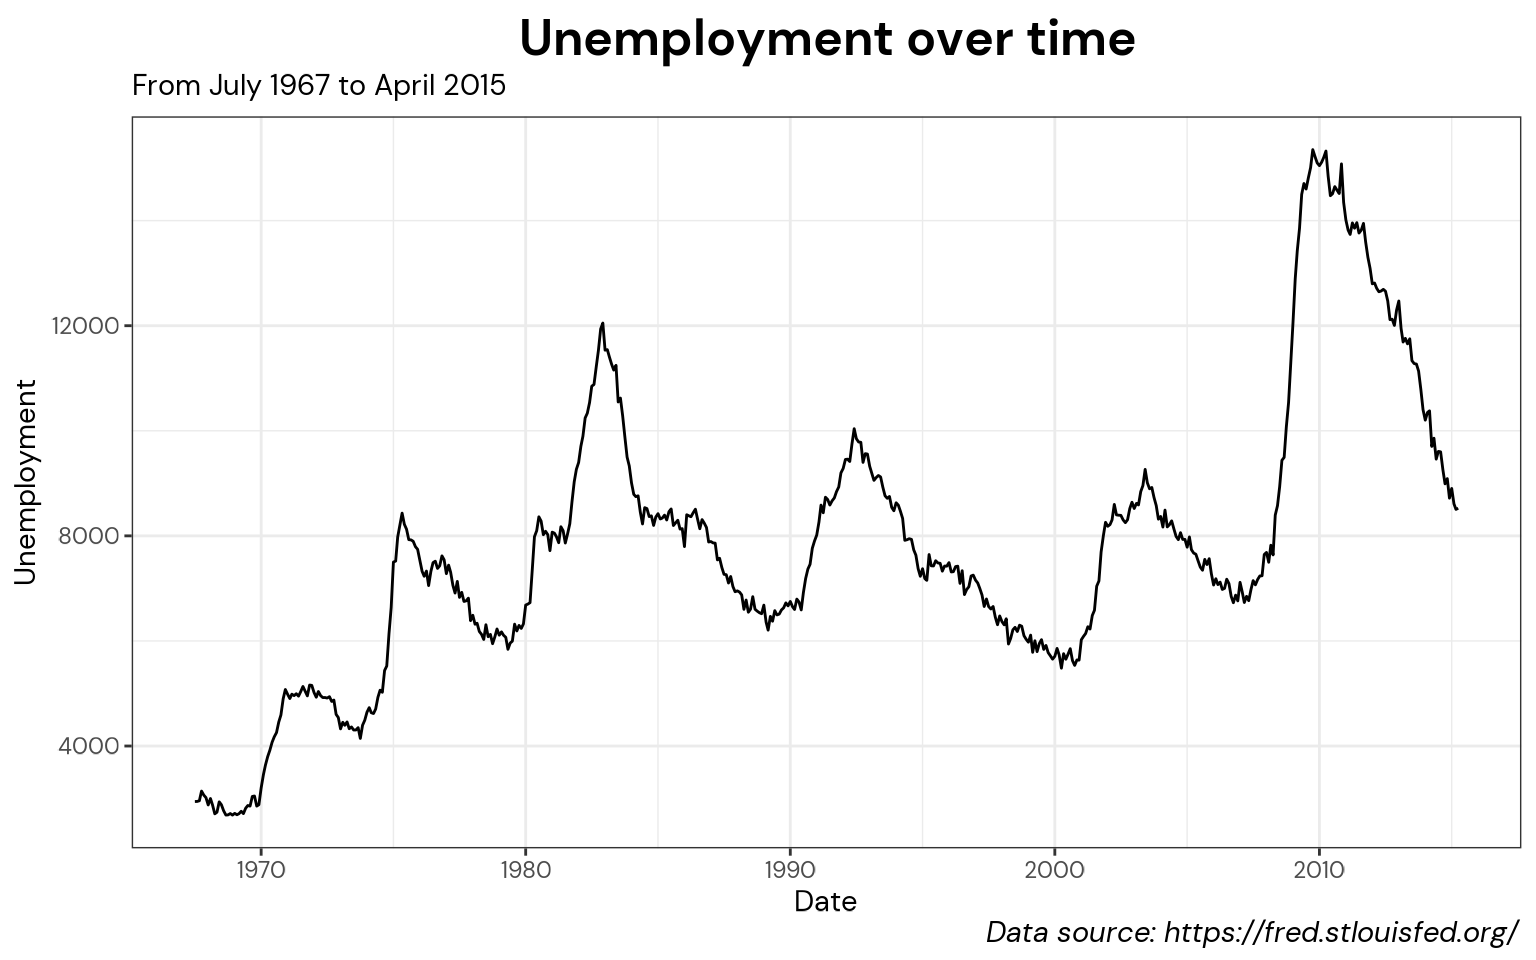
Line graphs/time series
ggplot(economics, aes(date, unemploy)) +
  geom_line() +
  labs(
    title = "Unemployment over time",
    subtitle = "From July 1967 to April 2015",
    caption = "Data source: https://fred.stlouisfed.org/",
    x = "Date",
    y = "Unemployment"
  )
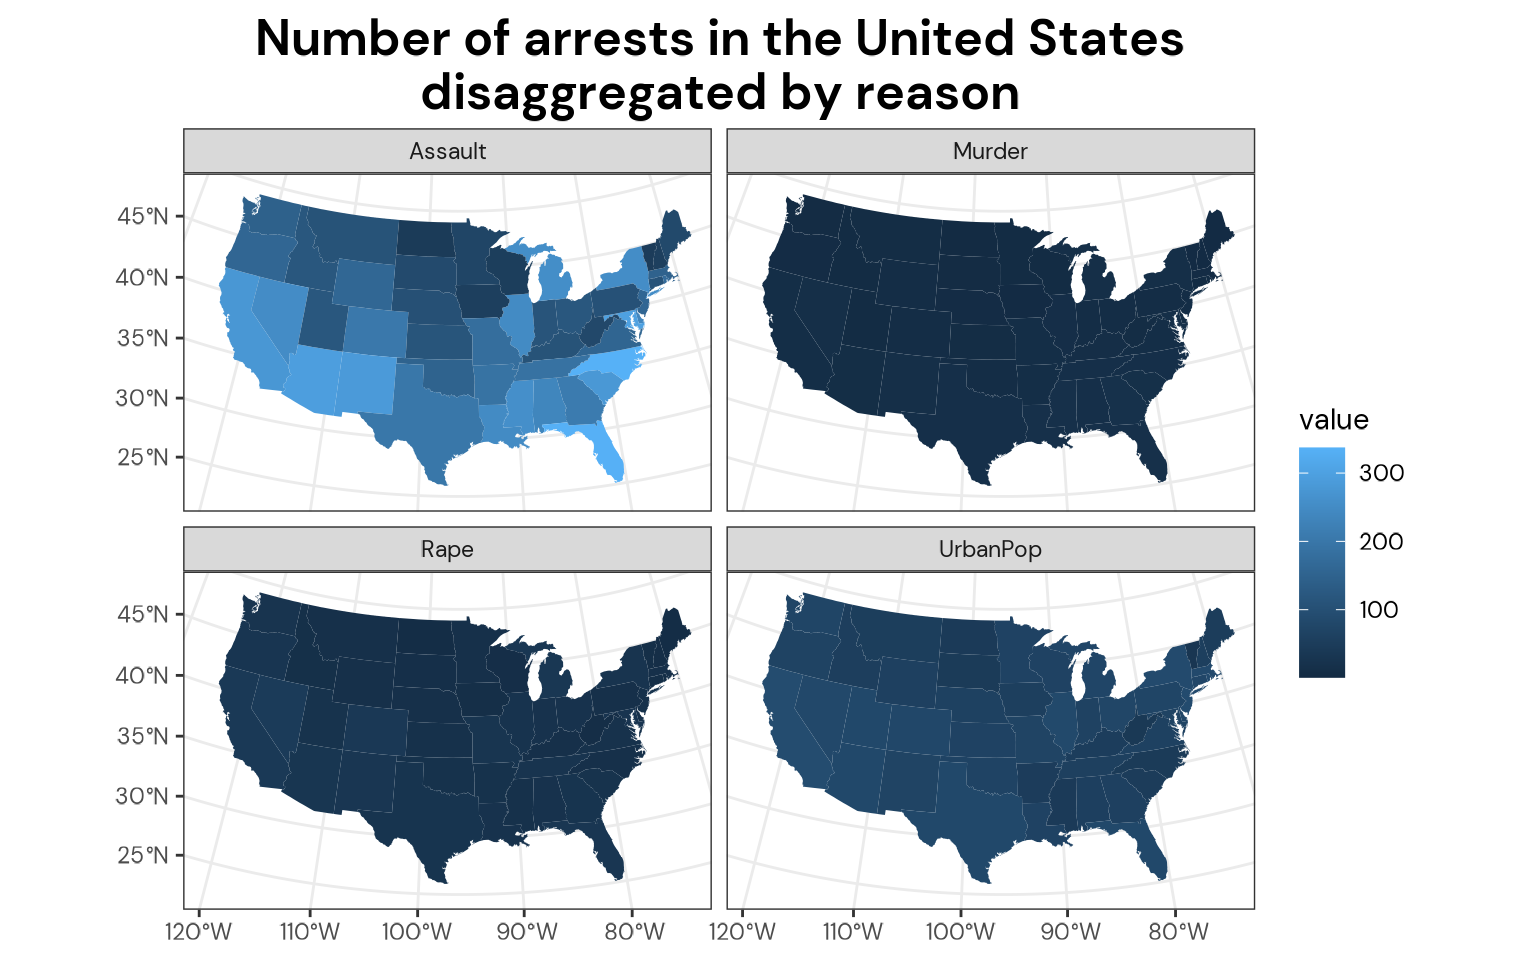
Maps
crimes <- data.frame(state = tolower(rownames(USArrests)), USArrests)

# Equivalent to crimes %>% tidyr::pivot_longer(Murder:Rape)
vars <- lapply(names(crimes)[-1], function(j) {
  data.frame(state = crimes$state, variable = j, value = crimes[[j]])
})
crimes_long <- do.call("rbind", vars)

states_map <- map_data("state")

ggplot(crimes_long, aes(map_id = state)) +
  geom_map(aes(fill = value), map = states_map) +
  coord_sf(
    crs = 5070, default_crs = 4326,
    xlim = c(-125, -70), ylim = c(25, 52)
  ) +
  facet_wrap(~variable) +
  labs(
    # multi-line title
    title = "Number of arrests in the United States\ndisaggregated by reason"
  )
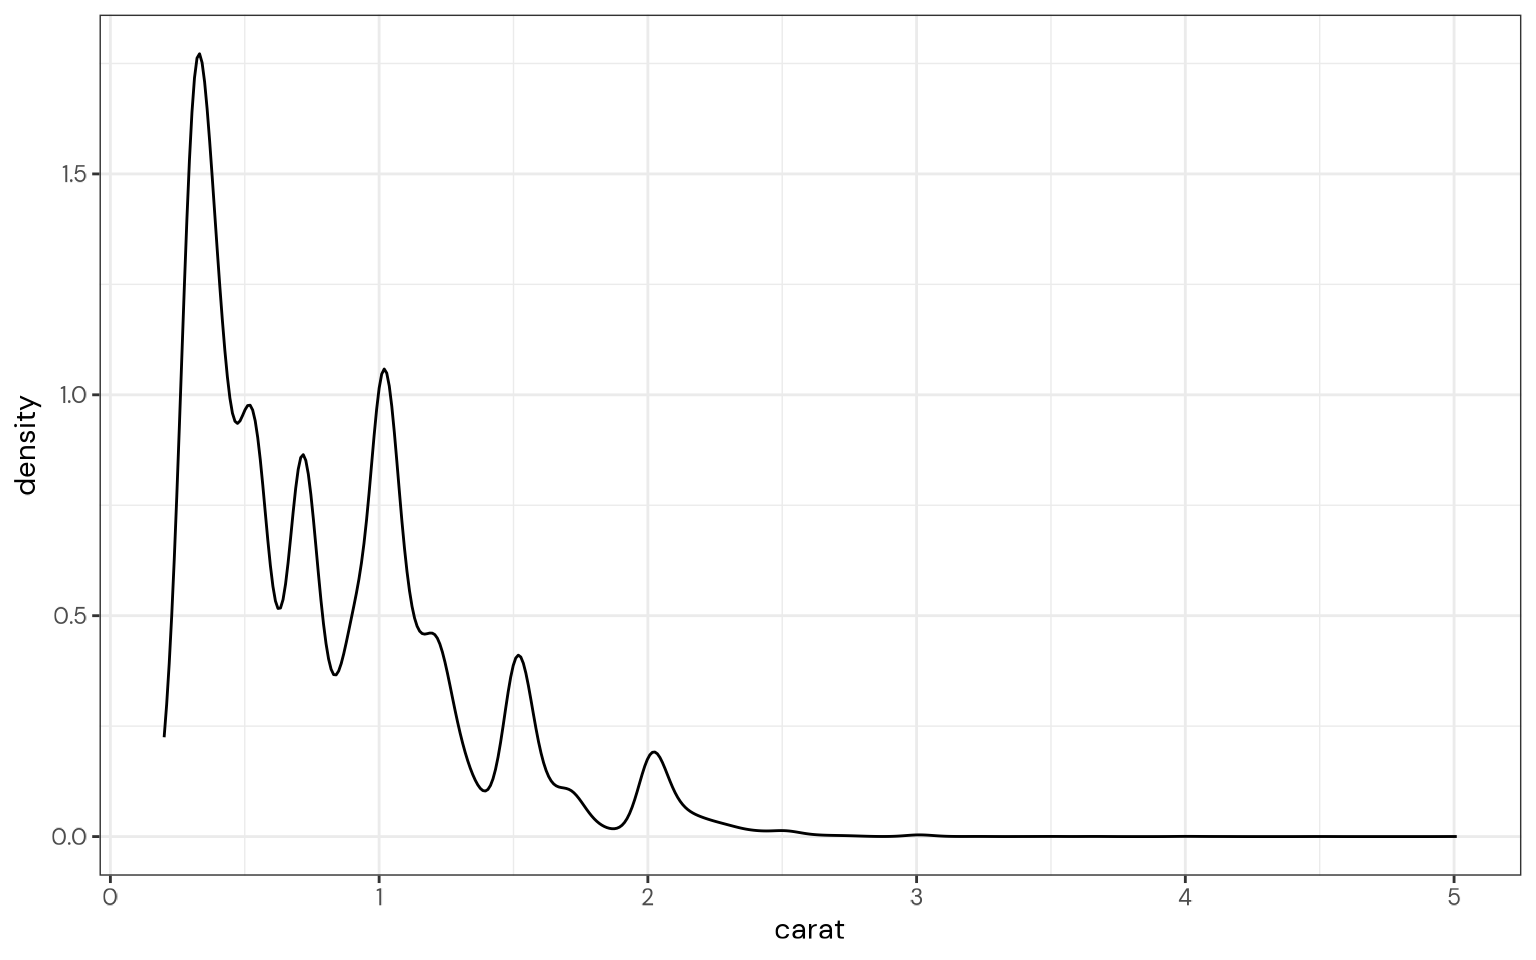
Distribution plots (parametric and non-parametric)
ggplot() +
  geom_function(fun = dnorm) +
  xlim(-5, 5)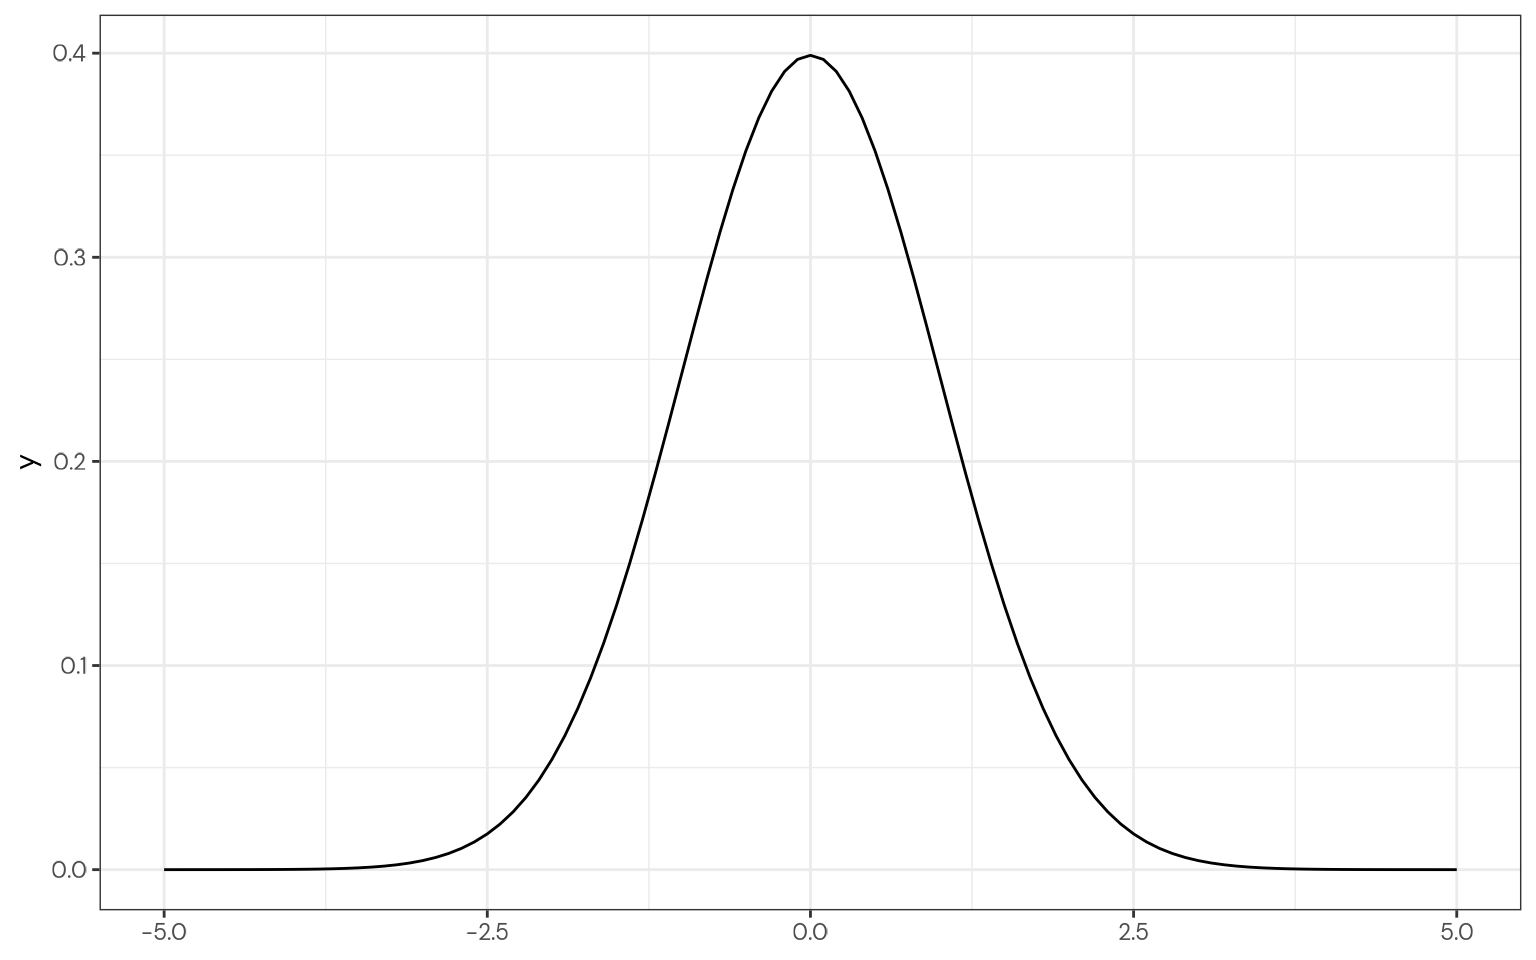
Heatmaps
ggplot(faithful, aes(x = eruptions, y = waiting)) +
  geom_point() +
  geom_density_2d_filled(alpha = 0.5)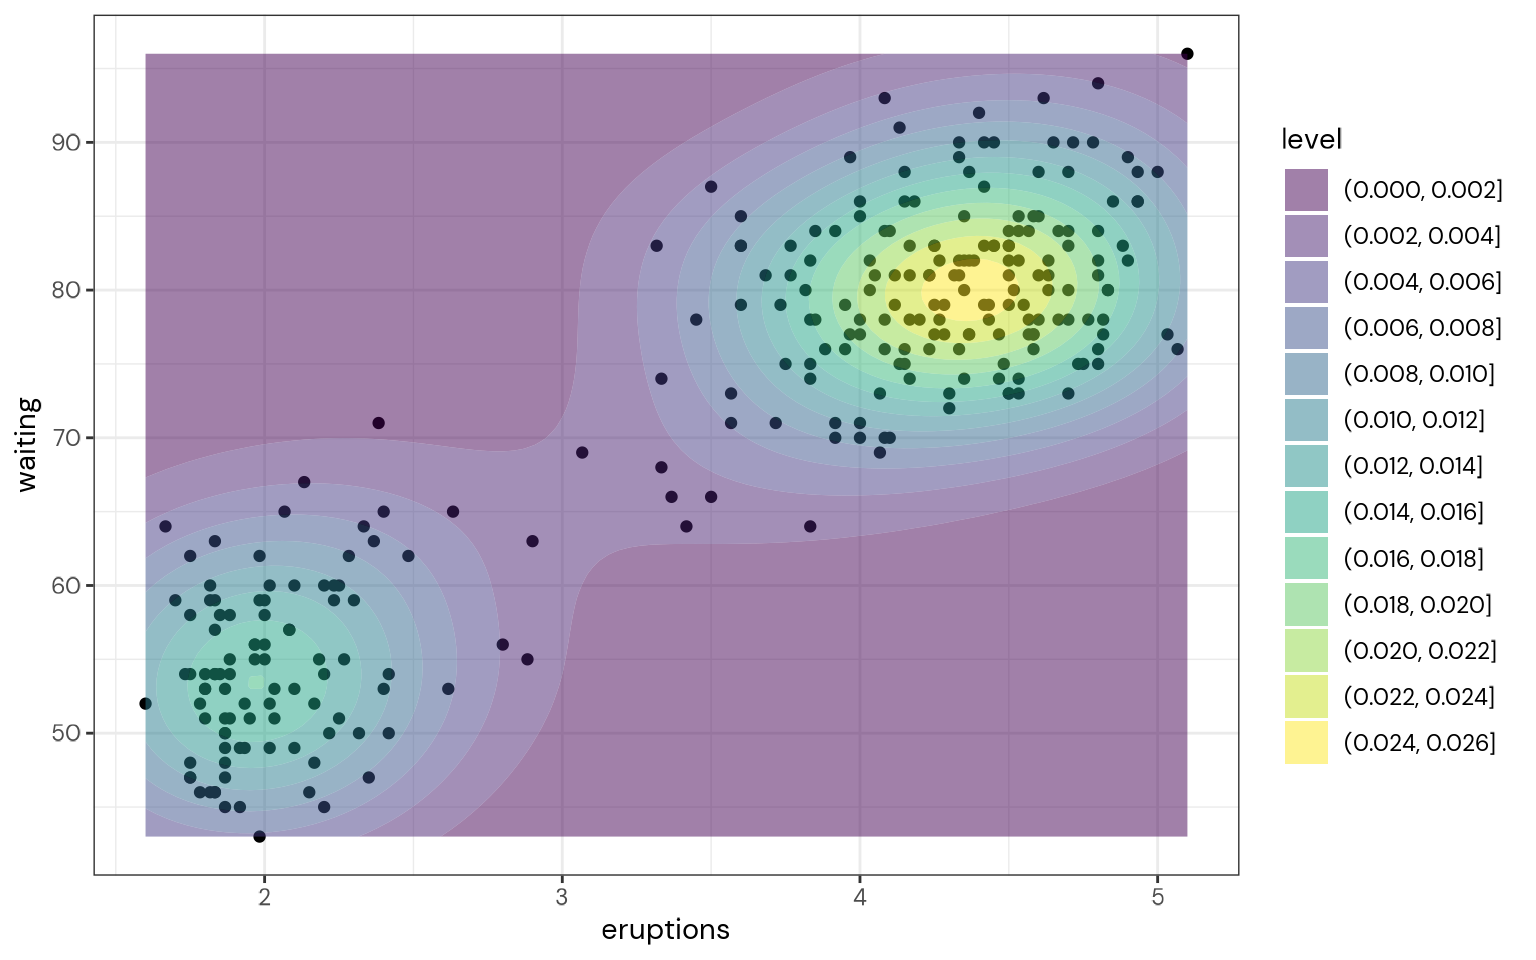
ggplot(diamonds, aes(x, y)) +
  geom_bin_2d()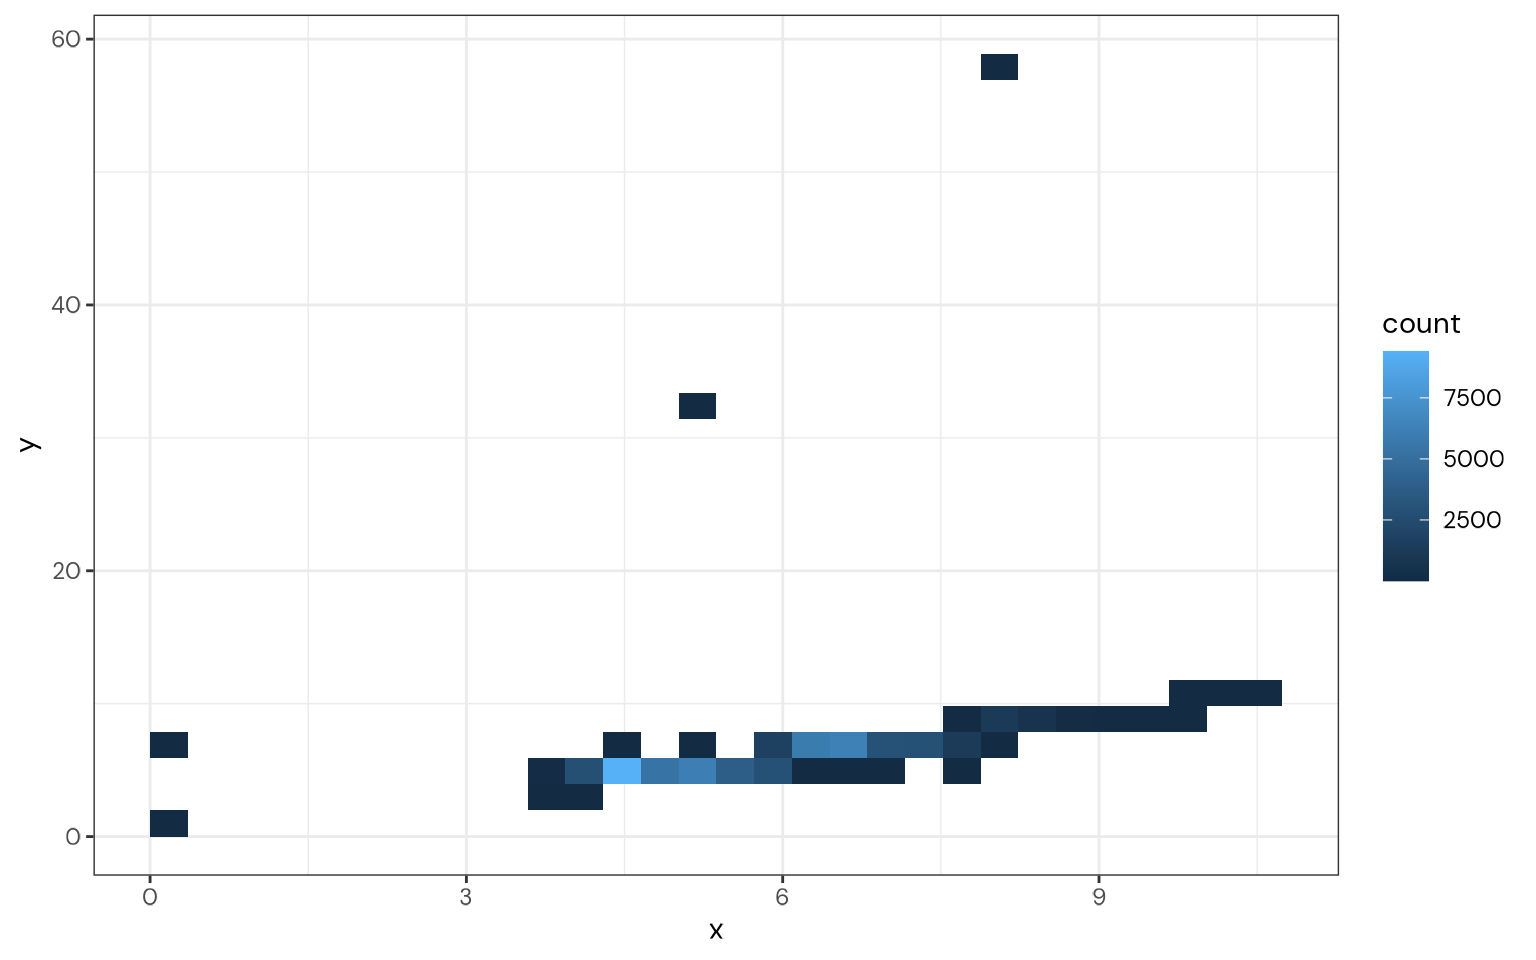
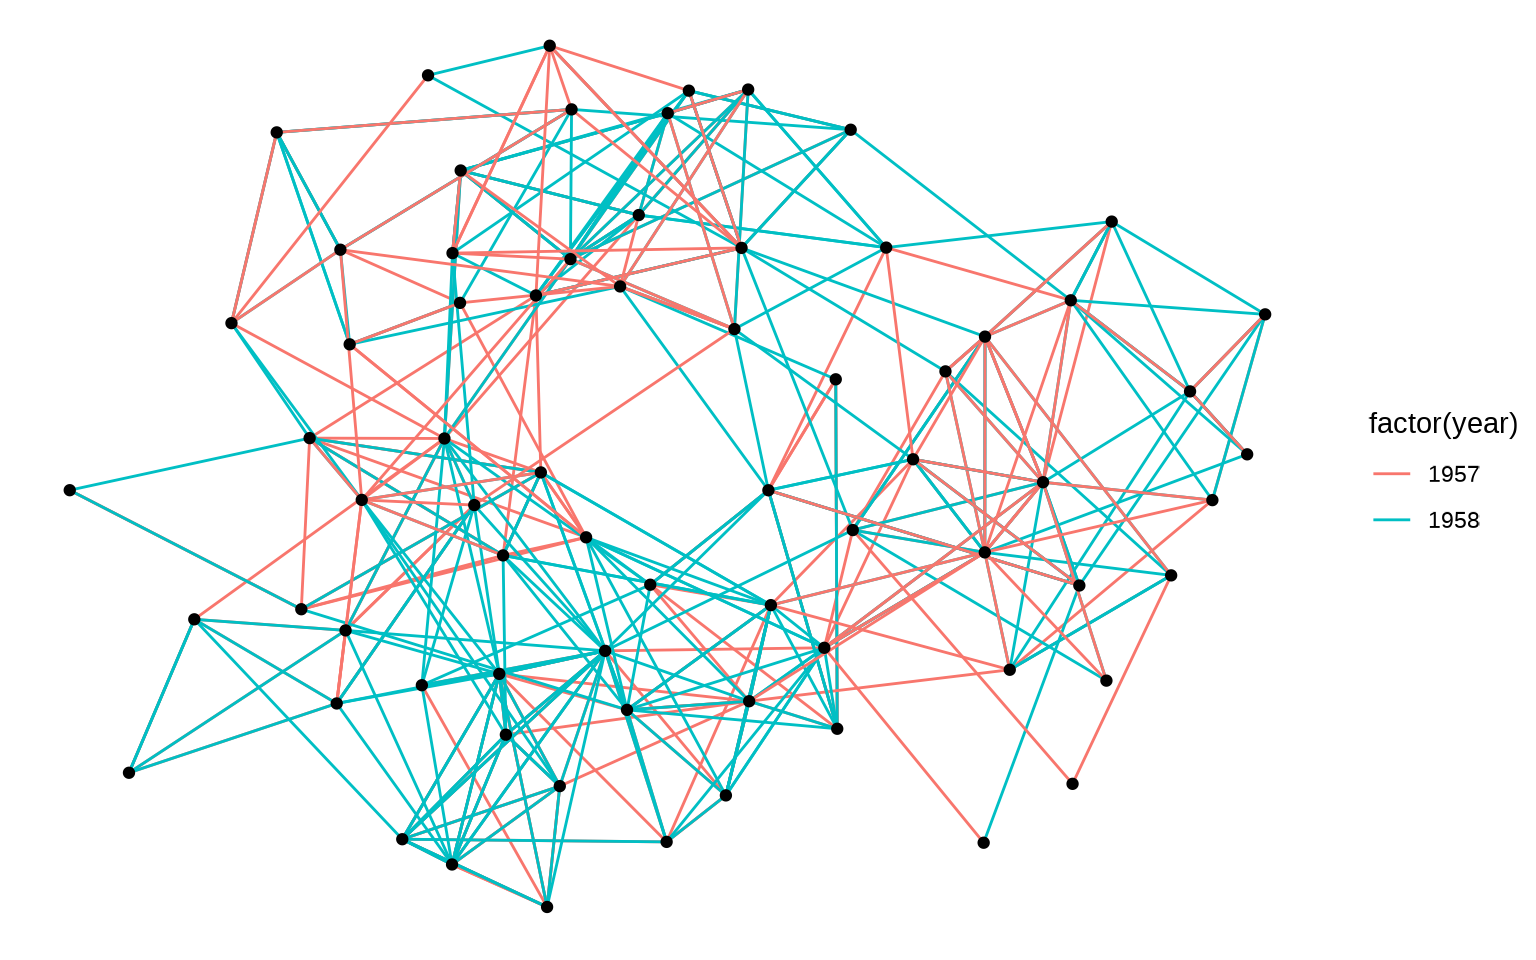
Networks
This example is pulled from ggraph documentation
library(ggraph)
library(tidygraph)
#>
#> Attaching package: 'tidygraph'
#> The following object is masked from 'package:stats':
#>
#>     filter

set_graph_style(plot_margin = margin(1, 1, 1, 1))
graph <- as_tbl_graph(highschool)

# Not specifying the layout - defaults to "auto"
ggraph(graph) +
  geom_edge_link(aes(colour = factor(year))) +
  geom_node_point()
#> Using "stress" as default layout
#> Warning in grid.Call(C_stringMetric, as.graphicsAnnot(x$label)): font family
#> 'Arial Narrow' not found, will use 'sans' instead
#> Warning in grid.Call(C_stringMetric, as.graphicsAnnot(x$label)): font family
#> 'Arial Narrow' not found, will use 'sans' instead
#> Warning in grid.Call(C_stringMetric, as.graphicsAnnot(x$label)): font family
#> 'Arial Narrow' not found, will use 'sans' instead
#> Warning in grid.Call(C_stringMetric, as.graphicsAnnot(x$label)): font family
#> 'Arial Narrow' not found, will use 'sans' instead
#> Warning in grid.Call(C_stringMetric, as.graphicsAnnot(x$label)): font family
#> 'Arial Narrow' not found, will use 'sans' instead
#> Warning in grid.Call(C_stringMetric, as.graphicsAnnot(x$label)): font family
#> 'Arial Narrow' not found, will use 'sans' instead
#> Warning in grid.Call(C_stringMetric, as.graphicsAnnot(x$label)): font family
#> 'Arial Narrow' not found, will use 'sans' instead
#> Warning in grid.Call(C_stringMetric, as.graphicsAnnot(x$label)): font family
#> 'Arial Narrow' not found, will use 'sans' instead
#> Warning in grid.Call(C_stringMetric, as.graphicsAnnot(x$label)): font family
#> 'Arial Narrow' not found, will use 'sans' instead
#> Warning in grid.Call(C_stringMetric, as.graphicsAnnot(x$label)): font family
#> 'Arial Narrow' not found, will use 'sans' instead
#> Warning in grid.Call(C_stringMetric, as.graphicsAnnot(x$label)): font family
#> 'Arial Narrow' not found, will use 'sans' instead
#> Warning in grid.Call(C_stringMetric, as.graphicsAnnot(x$label)): font family
#> 'Arial Narrow' not found, will use 'sans' instead
#> Warning in grid.Call(C_stringMetric, as.graphicsAnnot(x$label)): font family
#> 'Arial Narrow' not found, will use 'sans' instead
#> Warning in grid.Call(C_stringMetric, as.graphicsAnnot(x$label)): font family
#> 'Arial Narrow' not found, will use 'sans' instead
#> Warning in grid.Call(C_stringMetric, as.graphicsAnnot(x$label)): font family
#> 'Arial Narrow' not found, will use 'sans' instead
#> Warning in grid.Call(C_stringMetric, as.graphicsAnnot(x$label)): font family
#> 'Arial Narrow' not found, will use 'sans' instead
#> Warning in grid.Call(C_stringMetric, as.graphicsAnnot(x$label)): font family
#> 'Arial Narrow' not found, will use 'sans' instead
#> Warning in grid.Call(C_stringMetric, as.graphicsAnnot(x$label)): font family
#> 'Arial Narrow' not found, will use 'sans' instead
#> Warning in grid.Call(C_stringMetric, as.graphicsAnnot(x$label)): font family
#> 'Arial Narrow' not found, will use 'sans' instead
#> Warning in grid.Call(C_stringMetric, as.graphicsAnnot(x$label)): font family
#> 'Arial Narrow' not found, will use 'sans' instead
#> Warning in grid.Call(C_stringMetric, as.graphicsAnnot(x$label)): font family
#> 'Arial Narrow' not found, will use 'sans' instead
#> Warning in grid.Call(C_stringMetric, as.graphicsAnnot(x$label)): font family
#> 'Arial Narrow' not found, will use 'sans' instead
#> Warning in grid.Call(C_stringMetric, as.graphicsAnnot(x$label)): font family
#> 'Arial Narrow' not found, will use 'sans' instead
#> Warning in grid.Call(C_stringMetric, as.graphicsAnnot(x$label)): font family
#> 'Arial Narrow' not found, will use 'sans' instead
#> Warning in grid.Call(C_stringMetric, as.graphicsAnnot(x$label)): font family
#> 'Arial Narrow' not found, will use 'sans' instead
#> Warning in grid.Call(C_stringMetric, as.graphicsAnnot(x$label)): font family
#> 'Arial Narrow' not found, will use 'sans' instead
#> Warning in grid.Call(C_stringMetric, as.graphicsAnnot(x$label)): font family
#> 'Arial Narrow' not found, will use 'sans' instead
#> Warning in grid.Call(C_stringMetric, as.graphicsAnnot(x$label)): font family
#> 'Arial Narrow' not found, will use 'sans' instead
#> Warning in grid.Call(C_textBounds, as.graphicsAnnot(x$label), x$x, x$y, : font
#> family 'Arial Narrow' not found, will use 'sans' instead
#> Warning in grid.Call(C_textBounds, as.graphicsAnnot(x$label), x$x, x$y, : font
#> family 'Arial Narrow' not found, will use 'sans' instead
#> Warning in grid.Call(C_textBounds, as.graphicsAnnot(x$label), x$x, x$y, : font
#> family 'Arial Narrow' not found, will use 'sans' instead
#> Warning in grid.Call(C_textBounds, as.graphicsAnnot(x$label), x$x, x$y, : font
#> family 'Arial Narrow' not found, will use 'sans' instead
#> Warning in grid.Call(C_textBounds, as.graphicsAnnot(x$label), x$x, x$y, : font
#> family 'Arial Narrow' not found, will use 'sans' instead
#> Warning in grid.Call(C_textBounds, as.graphicsAnnot(x$label), x$x, x$y, : font
#> family 'Arial Narrow' not found, will use 'sans' instead
#> Warning in grid.Call(C_textBounds, as.graphicsAnnot(x$label), x$x, x$y, : font
#> family 'Arial Narrow' not found, will use 'sans' instead
#> Warning in grid.Call.graphics(C_text, as.graphicsAnnot(x$label), x$x, x$y, :
#> font family 'Arial Narrow' not found, will use 'sans' instead
#> Warning in grid.Call.graphics(C_text, as.graphicsAnnot(x$label), x$x, x$y, :
#> font family 'Arial Narrow' not found, will use 'sans' instead
#> Warning in grid.Call.graphics(C_text, as.graphicsAnnot(x$label), x$x, x$y, :
#> font family 'Arial Narrow' not found, will use 'sans' instead
#> Warning in grid.Call.graphics(C_text, as.graphicsAnnot(x$label), x$x, x$y, :
#> font family 'Arial Narrow' not found, will use 'sans' instead
#> Warning in grid.Call.graphics(C_text, as.graphicsAnnot(x$label), x$x, x$y, :
#> font family 'Arial Narrow' not found, will use 'sans' instead
#> Warning in grid.Call.graphics(C_text, as.graphicsAnnot(x$label), x$x, x$y, :
#> font family 'Arial Narrow' not found, will use 'sans' instead
#> Warning in grid.Call.graphics(C_text, as.graphicsAnnot(x$label), x$x, x$y, :
#> font family 'Arial Narrow' not found, will use 'sans' instead