## Clean and validate and plot outbreak data
# Load required R packages ------------------------------------------------
library(simulist)
library(cleanepi)
library(numberize)
library(incidence2)
library(tibble)
library(tidyr)
library(dplyr)
# Choose a seed that results in suitable and reproducible outbreak --------
set.seed(1)
# Simulate outbreak -------------------------------------------------------
line_list <- simulist::sim_linelist() %>%
# to tibble for tidier printing
tibble::as_tibble()
line_list
#> # A tibble: 158 × 13
#> id case_name case_type sex age date_onset date_reporting
#> <int> <chr> <chr> <chr> <int> <date> <date>
#> 1 1 James Manis suspected m 59 2023-01-01 2023-01-01
#> 2 2 Chen Moua confirmed m 90 2023-01-01 2023-01-01
#> 3 3 David Welter confirmed m 4 2023-01-02 2023-01-02
#> 4 5 Christopher Turner confirmed m 29 2023-01-04 2023-01-04
#> 5 6 Morgan Bohn suspected f 14 2023-01-05 2023-01-05
#> 6 7 Yutitham Corpuz probable m 85 2023-01-06 2023-01-06
#> 7 10 Cornelius Stadelbauer probable m 25 2023-01-13 2023-01-13
#> 8 11 Hafsa al-Arshad confirmed f 34 2023-01-11 2023-01-11
#> 9 12 Maiya Kim suspected f 89 2023-01-13 2023-01-13
#> 10 14 Junaid al-Hoque suspected m 63 2023-01-11 2023-01-11
#> # ℹ 148 more rows
#> # ℹ 6 more variables: date_admission <date>, outcome <chr>,
#> # date_outcome <date>, date_first_contact <date>, date_last_contact <date>,
#> # ct_value <dbl>
# Create messy line list data ---------------------------------------------
line_list <- simulist::messy_linelist(line_list, inconsistent_dates = TRUE)
line_list
#> # A tibble: 174 × 13
#> id case_name case_type sex age date_onset date_reporting
#> <chr> <chr> <chr> <chr> <chr> <chr> <chr>
#> 1 one James Manis suspected m 59 <NA> <NA>
#> 2 two ChenhMoua coxfirmed <NA> 90 01 Jan 20… 01 Jan 2023
#> 3 3 David Welter confirmed m four <NA> <NA>
#> 4 five <NA> confirmed m twent… 04-01-2023 04-01-2023
#> 5 6 Morgan Bohn suspected Female fourt… 2023/01/05 2023/01/05
#> 6 seven Yutitham Corpuz probable M eight… 2023-01-06 2023-01-06
#> 7 10 Cornelius Stadelbauer <NA> <NA> twent… 13/01/2023 13/01/2023
#> 8 10 Cornelius Stadelbauer <NA> <NA> twent… 13/01/2023 13/01/2023
#> 9 11 Hafsa al-Arshad confirmed F <NA> 2023-01-11 2023-01-11
#> 10 12 Maiya Kim suspected f 89 <NA> 13/01/2023
#> # ℹ 164 more rows
#> # ℹ 6 more variables: date_admission <chr>, outcome <chr>, date_outcome <chr>,
#> # date_first_contact <chr>, date_last_contact <chr>, ct_value <chr>
# Tag line list of data validation ----------------------------------------
# see what tags are available
linelist::tags_names()
#> [1] "id" "date_onset" "date_reporting" "date_admission"
#> [5] "date_discharge" "date_outcome" "date_death" "gender"
#> [9] "age" "location" "occupation" "hcw"
#> [13] "outcome"
# in this case the tags have the same name but line list columns can be
# named differently from the tag names
line_list <- linelist::make_linelist(
x = line_list,
date_onset = "date_onset",
date_admission = "date_admission",
date_outcome = "date_outcome"
)
line_list
#>
#> // linelist object
#> # A tibble: 174 × 13
#> id case_name case_type sex age date_onset date_reporting
#> <chr> <chr> <chr> <chr> <chr> <chr> <chr>
#> 1 one James Manis suspected m 59 <NA> <NA>
#> 2 two ChenhMoua coxfirmed <NA> 90 01 Jan 20… 01 Jan 2023
#> 3 3 David Welter confirmed m four <NA> <NA>
#> 4 five <NA> confirmed m twent… 04-01-2023 04-01-2023
#> 5 6 Morgan Bohn suspected Female fourt… 2023/01/05 2023/01/05
#> 6 seven Yutitham Corpuz probable M eight… 2023-01-06 2023-01-06
#> 7 10 Cornelius Stadelbauer <NA> <NA> twent… 13/01/2023 13/01/2023
#> 8 10 Cornelius Stadelbauer <NA> <NA> twent… 13/01/2023 13/01/2023
#> 9 11 Hafsa al-Arshad confirmed F <NA> 2023-01-11 2023-01-11
#> 10 12 Maiya Kim suspected f 89 <NA> 13/01/2023
#> # ℹ 164 more rows
#> # ℹ 6 more variables: date_admission <chr>, outcome <chr>, date_outcome <chr>,
#> # date_first_contact <chr>, date_last_contact <chr>, ct_value <chr>
#>
#> // tags: date_onset:date_onset, date_admission:date_admission, date_outcome:date_outcome
# line list can be validated using tags
# this will error due to the line list being messy
# linelist::validate_linelist(line_list)
# Scan line list data for issues ------------------------------------------
# see {cleanepi} website: https://epiverse-trace.github.io/cleanepi/
cleanepi::scan_data(line_list)
#> Field_names missing numeric date character logical
#> 1 id 0.0875 0.5375 0 0.4625 0
#> 2 case_name 0.1757 0.0000 0 1.0000 0
#> 3 case_type 0.1013 0.0000 0 1.0000 0
#> 4 sex 0.2168 0.0000 0 1.0000 0
#> 5 age 0.1299 0.5065 0 0.4935 0
#> 6 date_onset 0.1523 0.0000 1 0.0000 0
#> 7 date_reporting 0.2340 0.0000 1 0.0000 0
#> 8 date_admission 4.2727 0.0000 1 0.0000 0
#> 9 outcome 0.1299 0.0000 0 1.0000 0
#> 10 date_outcome 5.4444 0.0000 1 0.0000 0
#> 11 date_first_contact 0.1523 0.0000 1 0.0000 0
#> 12 date_last_contact 0.0741 0.0000 1 0.0000 0
#> 13 ct_value 1.1750 1.0000 0 0.0000 0
# Clean line list ---------------------------------------------------------
line_list$age <- numberize::numberize(line_list$age)
line_list$age
#> [1] 59 90 4 29 14 85 25 25 NA 89 63 74 34 29 46 46 24 41 41 72 6 61 61 44 71
#> [26] 69 61 64 61 66 66 81 81 53 45 42 78 35 54 54 68 3 44 62 35 90 25 46 8 8
#> [51] NA 54 67 NA 73 13 72 61 22 29 17 NA 90 23 NA 62 NA 44 57 63 46 66 68 12 51
#> [76] 2 53 NA 82 25 76 14 76 78 75 76 80 41 NA 28 2 82 5 NA 44 76 3 15 19 76
#> [101] 90 64 NA NA NA 18 79 49 49 56 76 41 29 39 32 9 9 39 12 52 NA 68 57 8 28
#> [126] 2 84 52 58 29 30 71 43 40 NA NA 69 38 NA 82 19 19 46 71 4 NA 16 53 14 48
#> [151] 89 39 NA NA 28 42 42 71 9 61 53 76 69 50 50 7 45 45 83 NA 88 79 82 82
line_list$id <- numberize::numberize(line_list$id)
line_list$id
#> [1] 1 2 3 5 6 7 10 10 11 12 14 18 19 22 24 24 27 29
#> [19] 29 30 31 33 33 34 35 NA 39 41 44 45 45 47 47 50 51 53
#> [37] NA 55 56 56 58 59 60 63 64 65 66 71 73 73 77 78 80 85
#> [55] NA 89 90 93 97 98 101 108 111 113 114 116 119 120 NA 123 125 126
#> [73] 130 131 NA 138 139 142 143 145 146 147 150 153 154 155 157 158 159 163
#> [91] 164 166 171 172 173 NA 175 176 177 178 182 NA 189 195 195 196 197 199
#> [109] 199 200 201 202 205 209 NA 211 211 213 214 219 221 224 NA 229 230 NA
#> [127] 233 234 235 236 238 240 NA 245 250 NA NA 253 254 255 258 258 261 262
#> [145] 264 265 NA 268 277 278 279 280 282 284 285 291 291 292 293 296 298 301
#> [163] 302 304 304 307 310 310 311 313 316 320 326 326
cleanepi::check_subject_ids(line_list, target_columns = "id", range = c(1, nrow(line_list)))
#>
#> // linelist object
#> # A tibble: 174 × 13
#> id case_name case_type sex age date_onset date_reporting
#> <chr> <chr> <chr> <chr> <dbl> <chr> <chr>
#> 1 1 James Manis suspected m 59 <NA> <NA>
#> 2 2 ChenhMoua coxfirmed <NA> 90 01 Jan 2023 01 Jan 2023
#> 3 3 David Welter confirmed m 4 <NA> <NA>
#> 4 5 <NA> confirmed m 29 04-01-2023 04-01-2023
#> 5 6 Morgan Bohn suspected Female 14 2023/01/05 2023/01/05
#> 6 7 Yutitham Corpuz probable M 85 2023-01-06 2023-01-06
#> 7 10 Cornelius Stadelbauer <NA> <NA> 25 13/01/2023 13/01/2023
#> 8 10 Cornelius Stadelbauer <NA> <NA> 25 13/01/2023 13/01/2023
#> 9 11 Hafsa al-Arshad confirmed F NA 2023-01-11 2023-01-11
#> 10 12 Maiya Kim suspected f 89 <NA> 13/01/2023
#> # ℹ 164 more rows
#> # ℹ 6 more variables: date_admission <chr>, outcome <chr>, date_outcome <chr>,
#> # date_first_contact <chr>, date_last_contact <chr>, ct_value <chr>
#>
#> // tags: date_onset:date_onset, date_admission:date_admission, date_outcome:date_outcome
# routine cleaning steps to tidy column names and remove duplicated rows
line_list <- line_list %>%
cleanepi::standardize_column_names() %>%
cleanepi::remove_constants() %>%
cleanepi::remove_duplicates()
date_columns <- colnames(line_list)[startsWith(colnames(line_list), "date_")]
line_list <- line_list %>%
cleanepi::standardize_dates(target_columns = date_columns)
# clean inconsistent sex using dictionary ---------------------------------
# Find inconsistencies
line_list %>% count(sex)
#>
#> // linelist object
#> # A tibble: 13 × 2
#> sex n
#> <chr> <int>
#> 1 Demale 1
#> 2 F 24
#> 3 Female 11
#> 4 Femaly 1
#> 5 M 17
#> 6 Male 16
#> 7 f 19
#> 8 femace 1
#> 9 female 11
#> 10 femsle 1
#> 11 m 19
#> 12 male 13
#> 13 <NA> 24
#>
#> // tags: date_onset:date_onset, date_admission:date_admission, date_outcome:date_outcome
# Define dictionary
dat_dictionary <- tibble::tribble(
~options, ~values, ~grp, ~orders,
"1", "male", "sex", 1L,
"2", "female", "sex", 2L,
"M", "male", "sex", 3L,
"F", "female", "sex", 4L,
"m", "male", "sex", 5L,
"f", "female", "sex", 6L
)
# # Apply dictionary
# line_list <- line_list %>%
# cleanepi::clean_using_dictionary(
# dictionary = dat_dictionary
# )
# Very coverage of dictionary to solve the inconsistencies
line_list %>% count(sex)
#>
#> // linelist object
#> # A tibble: 13 × 2
#> sex n
#> <chr> <int>
#> 1 Demale 1
#> 2 F 24
#> 3 Female 11
#> 4 Femaly 1
#> 5 M 17
#> 6 Male 16
#> 7 f 19
#> 8 femace 1
#> 9 female 11
#> 10 femsle 1
#> 11 m 19
#> 12 male 13
#> 13 <NA> 24
#>
#> // tags: date_onset:date_onset, date_admission:date_admission, date_outcome:date_outcome
# clean spelling mistakes using dictionary
line_list$case_type[agrep(pattern = "suspected", x = line_list$case_type)] <- "suspected"
line_list$case_type[agrep(pattern = "probable", x = line_list$case_type)] <- "probable"
line_list$case_type[agrep(pattern = "confirmed", x = line_list$case_type)] <- "confirmed"
line_list$outcome[agrep(pattern = "recovered", x = line_list$outcome)] <- "recovered"
line_list$outcome[agrep(pattern = "died", x = line_list$outcome)] <- "died"
# Validate clean line list ------------------------------------------------
# line list is now valid after cleaning
line_list_validated <- linelist::validate_linelist(line_list)
# Now, get data frame with tagged columns only
line_list_validated_tags <- linelist::tags_df(line_list_validated)
line_list_validated_tags
#> # A tibble: 158 × 3
#> date_onset date_admission date_outcome
#> <date> <date> <date>
#> 1 NA 2023-01-09 2023-01-13
#> 2 2023-01-01 NA NA
#> 3 NA NA NA
#> 4 2023-01-04 NA NA
#> 5 2023-01-05 2023-01-09 2023-01-23
#> 6 2023-01-06 2023-01-08 NA
#> 7 2023-01-13 NA NA
#> 8 2023-01-11 2023-01-24 2023-01-27
#> 9 NA NA NA
#> 10 2023-01-11 NA NA
#> # ℹ 148 more rows
# Aggregate and visualise data --------------------------------------------
# see visualising line list data vignette: https://epiverse-trace.github.io/simulist/articles/vis-linelist.html
# aggregate to daily incidence data
daily <- incidence2::incidence(
x = line_list_validated_tags,
date_index = "date_onset",
interval = "daily",
complete_dates = TRUE
)
# plot(daily)
# aggregate to epiweek incidence data
weekly <- incidence2::incidence(
x = line_list_validated_tags,
date_index = "date_onset",
interval = "epiweek",
complete_dates = TRUE
)
# plot(weekly)
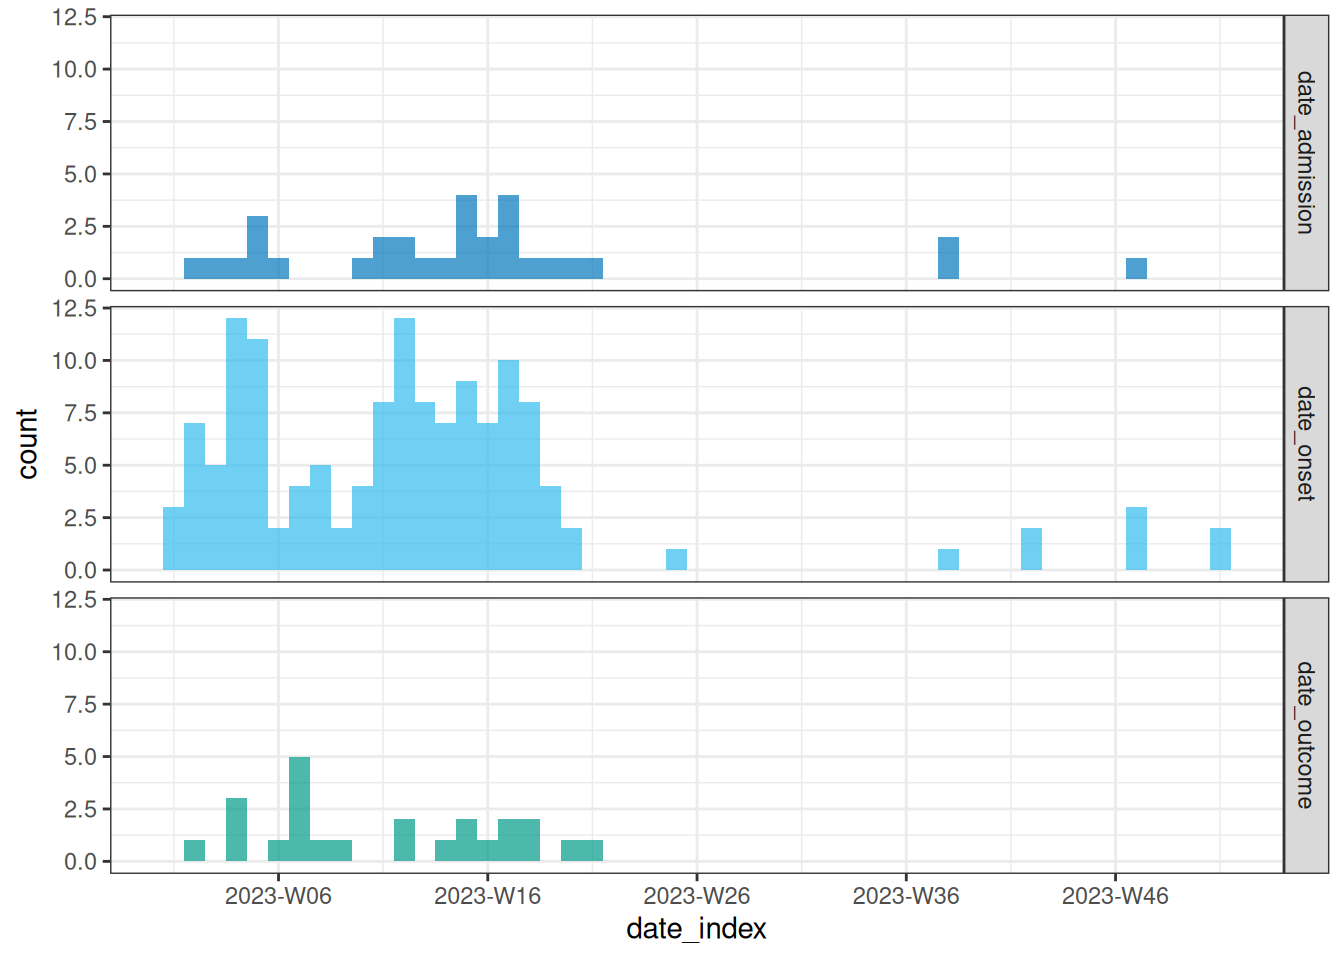
# aggregate and plot onset, hospital admission and death
weekly_chd <- line_list_validated_tags %>%
incidence2::incidence(
date_index = c("date_onset","date_admission","date_outcome"),
interval = "epiweek",
complete_dates = TRUE
)
plot(weekly_chd)