
This vignette summarises the findings from the 100 days and 100 lines of code workshop, hosted in December 2022 by Epiverse-TRACE.
To discuss how the first 100 lines of code during an epidemic should look like, we invited 40 experts, including academics, field epidemiologists, and software engineers, to take part in a 3-day workshop, where they discussed the current challenges, and potential solutions, in data analytic pipelines used to analyse epidemic data. In addition to highlighting existing technical solutions and their use cases, presentations on best practices in fostering collaboration across institutions and disciplines set the scene for the subsequent workshop scenario exercises.
What R packages and tools are available to use during an epidemic?
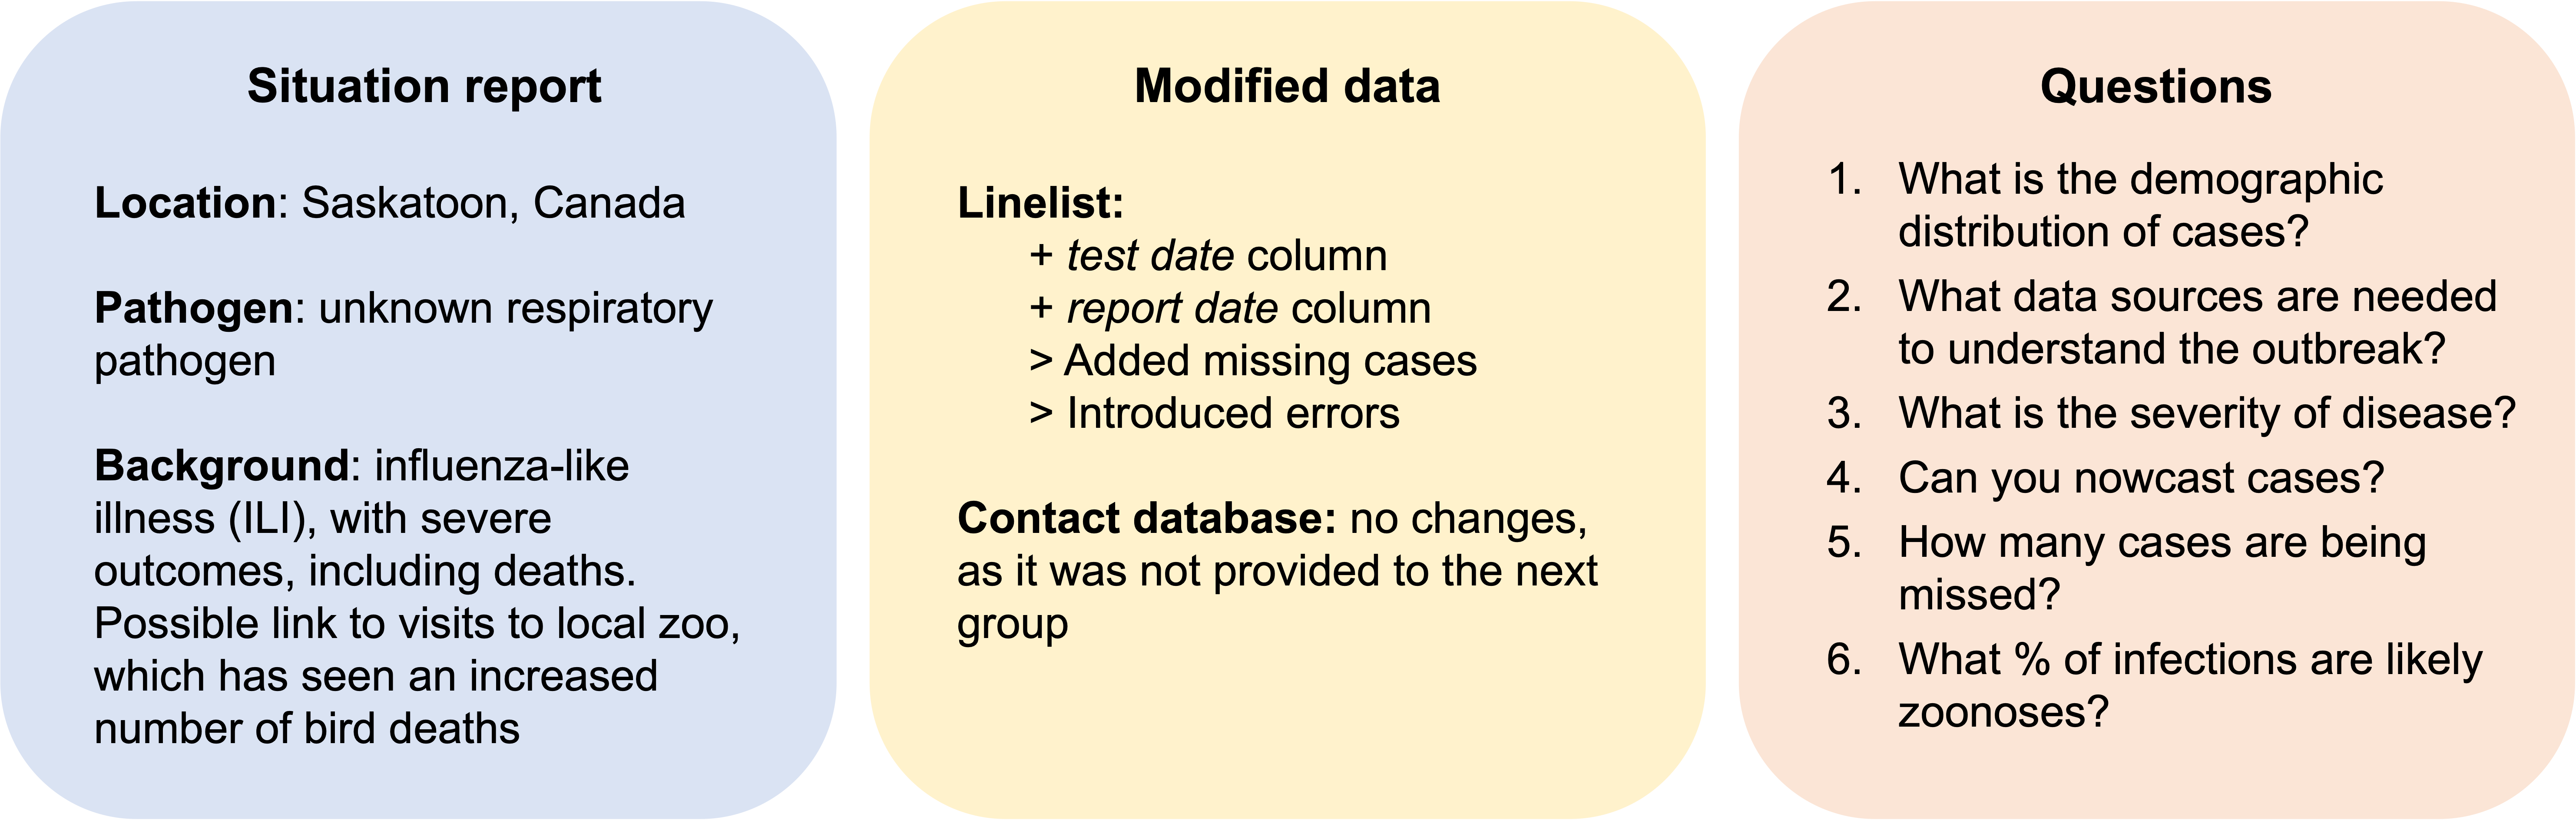
To investigate this in a similar setting to what an outbreak response team would experience, workshop participants were divided into groups, and asked to develop a plausible epidemic scenario, that included:
- A situation report, describing the characteristics of the epidemic
- A linelist of cases and contact tracing data, by modifying provided datasets containing simulated data
- A set of questions to address during the analytic process
Groups then exchanged epidemic scenarios and analysed the provided data to answer the questions indicated the previous group, as if they were a response team working to solve an outbreak. Details about each of these outbreak scenarios and the analytic pipelines developed by the groups are summarised in this vignette.
Simulating epidemic data
Before the workshop, a fictitious dataset was created, which consisted of a linelist and contact tracing information.
To generate linelist data, the package bpmodels was used to generate a branching process network. Cases were then transformed from the model output to a linelist format. To add plausible hospitalisations and deaths, delay distributions for SARS-CoV were extracted from epiparameter.
To create the contact tracing database, a random number of contacts was generated for each of the cases included in the linelist. These contacts were then assigned a category of became case, under follow up or lost to follow up, at random.
- Through this workshop, we identified the need for a tool to simulate outbreak data in a linelist format, to test analysis methods and other packages while having control over the characteristics of the test data. For this purpose, an R package is currently in progress, see simulist.
Scenario 1: Novel respiratory disease in The Gambia
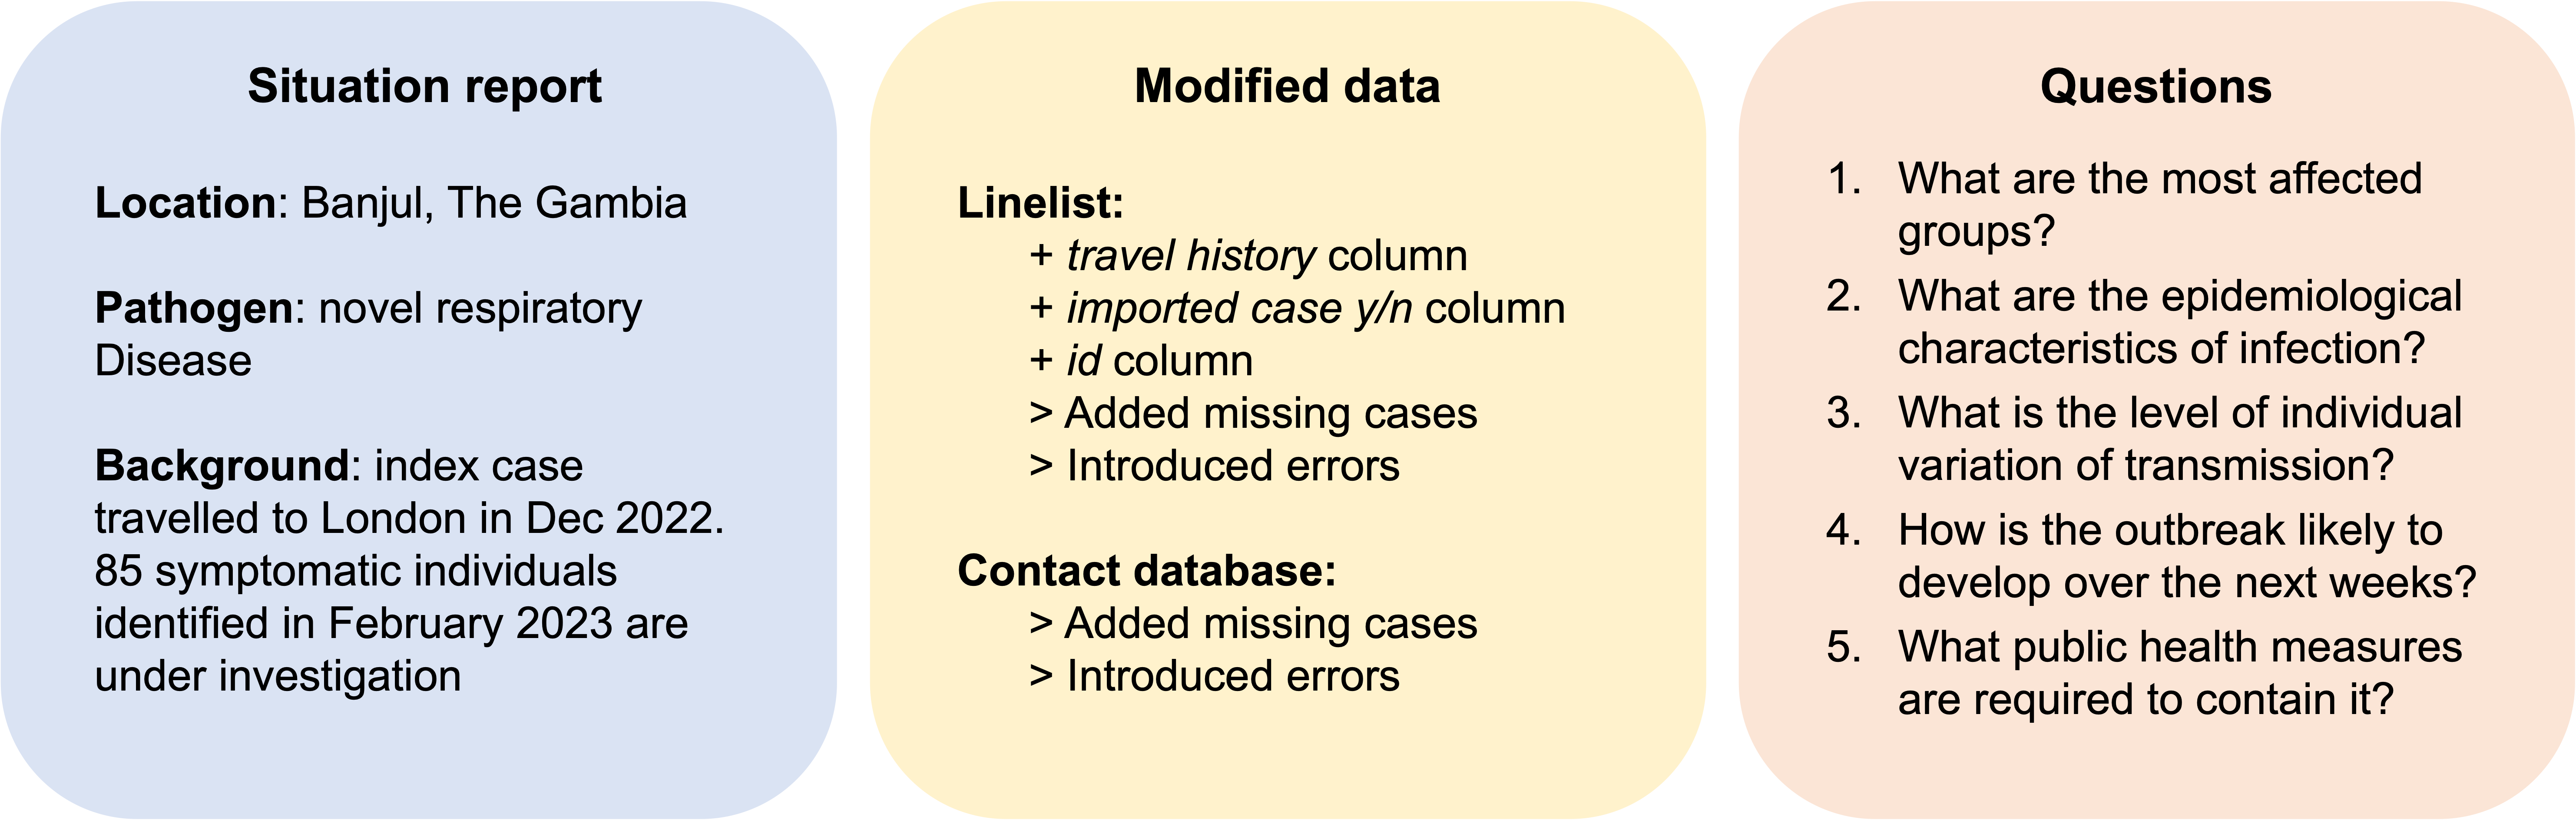
Analytic pipeline for scenario 1 (analysed by group 2)
- Data cleaning
- Delay distributions
fitdisrplusto fit parameteric distributions to scenario dataepiparameterto extract delay distributions from respiratory pathogensEpiNow2to fit reporting delaysEpiEstim/coarseDataToolsto estimate generation time/serial interval of diseaseepicontactsmixdiffto estimate delay distributions and correct erroneous dates at the same time (still under development)
- Population demographics
- Would like to have had access to an R package similar to
ColOpenData
- Would like to have had access to an R package similar to
- Risk factors of infection
- Used R4epis as a guide on how to create two-way tables and perform Chi-squared tests
- Severity of disease
datadelayfor CFR calculation- Implementation of method developed by AC Ghani, 2005 to estimate CFR
- Contact matching
- Epi curve and maps
- Used
incidenceandincidence2for incidence calculation and visualisation rasterto extract spatial information from library of shapefiles
- Used
- Reproduction number
APEestimbayEStimearlyRepicontactsepidemiaepiFilterEpiNow2EpiEstimR0outbreaker2- Used this comparison table to choose the most appropriate package.
- Superspreading, by using these resources:
- Epidemic projections
incidenceR estimation using a loglinear modelprojectionsusing Rt estimates, SI distributions and overdispersion estimates
- Transmission chains and strain characterisation
| Data analysis step | Challenges |
|---|---|
| Data cleaning | Not knowing what packages are available for this purpose |
| Delay distributions | Dealing with right truncation Accounting for multiple infectors |
| Population demographics | Lacking tools that provide information about population by age, gender, etc. |
| Risk factors of infection | Distinguishing between risk factors vs detecting differences in reporting frequencies among groups |
| Severity of disease | Knowing the prevalence of disease (denominator) Right truncated data Varying severity of different strains |
| Contact matching | Missing data Misspellings |
| Epicurve and maps | NA dates entries not included Reporting levels varying over time |
| Offspring distribution | Right truncation Time varying reporting efforts Assumption of a single homogeneous epidemic Importation of cases |
| Forecasting | Underlying assumption of a given R distribution, e.g., single trend, homogeneous mixing, no saturation |
Scenario 2: Outbreak of an unidentified disease in rural Colombia
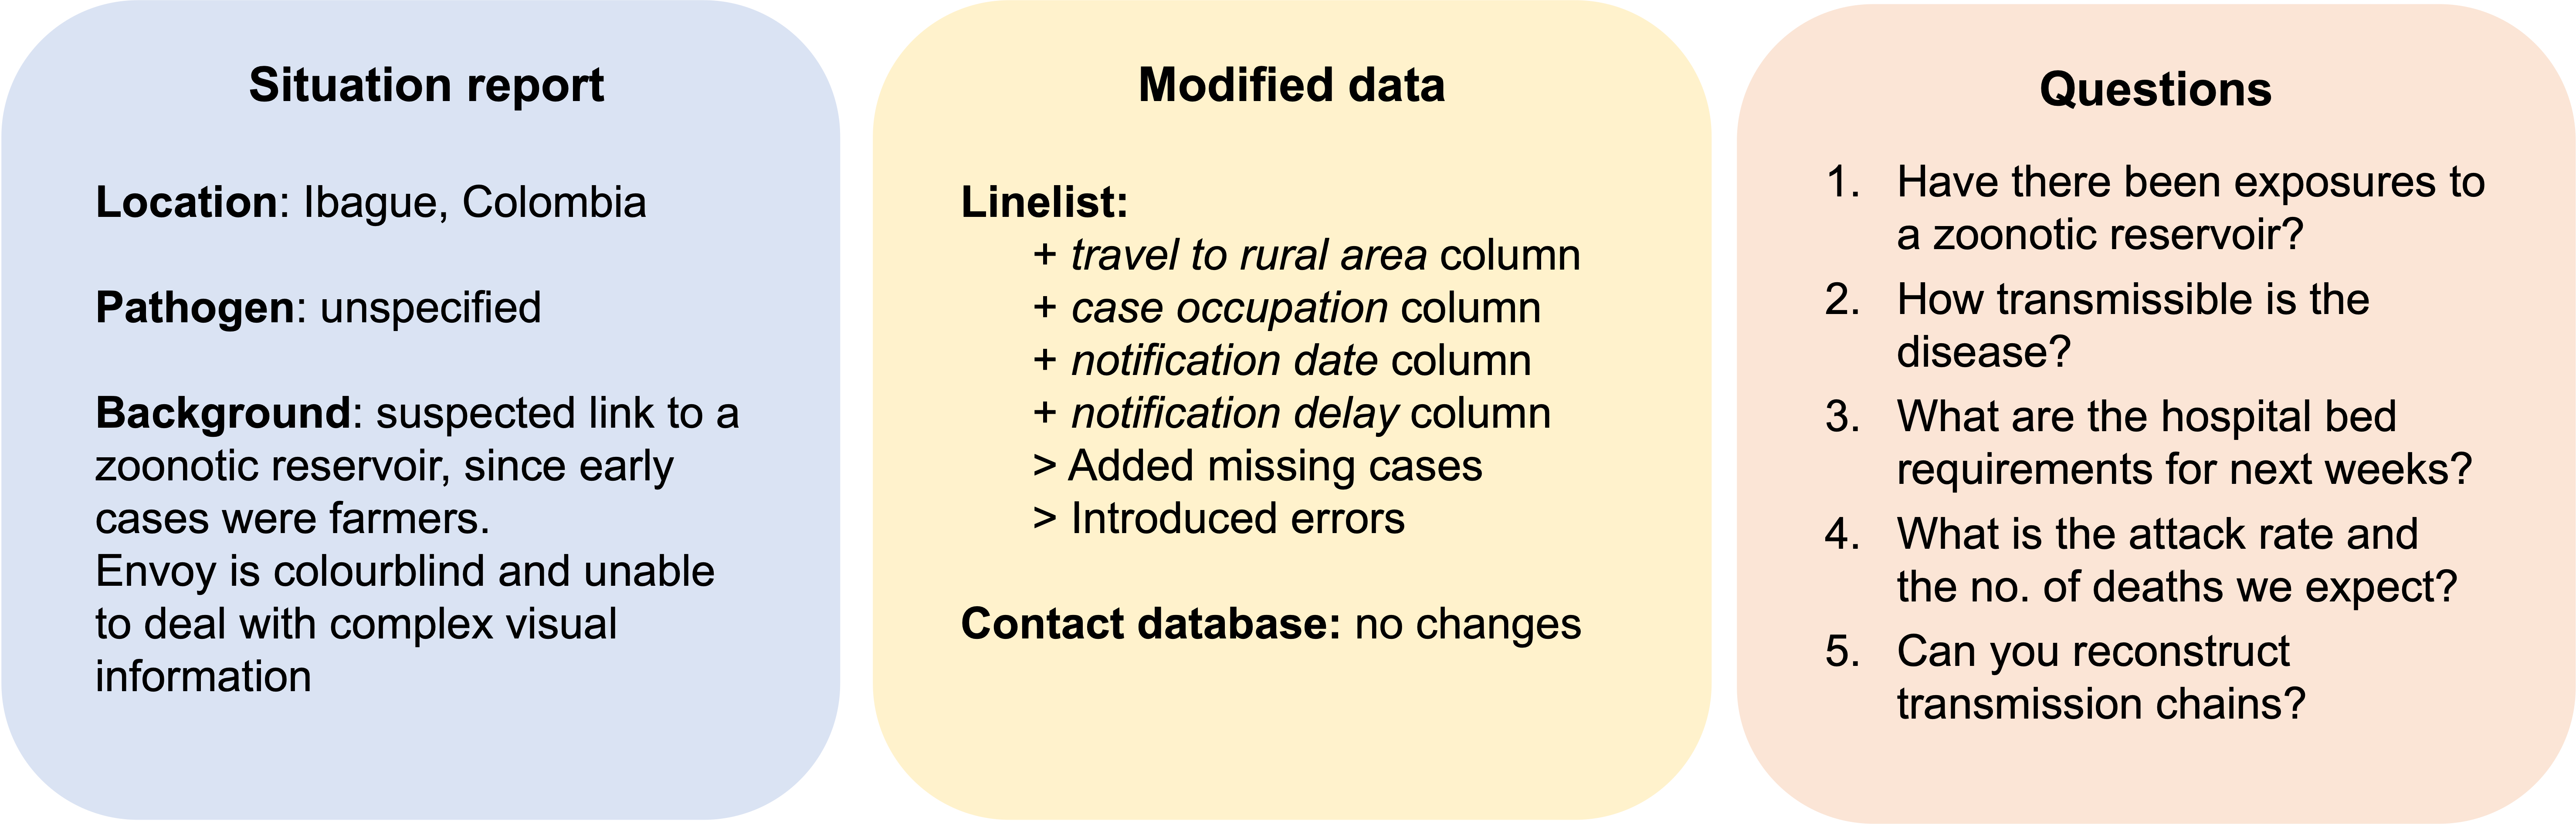
Analytic pipeline for scenario 2 (analysed by group 3)
- Data cleaning: manually, using R (no packages specified), to
- Fix data entry issues in columns onset_date and gender
- Check for missing data
- Check sequence of dates: symptom onset → hospitalisation → death
- Data anonymisation to share with partners
fastlinkfor probabilistic matching between cases ↔︎ contacts, based on names, dates, and ages
- Case demographics
apyramidto stratify data by age, gender, and health status
- Reproductive number calculation, by using two approaches:
- Manually, by calculating the number of cases generated by each source case, data management through
dplyranddata.table - Using serial interval of disease, through
EpiEstimorEpiNow2
- Manually, by calculating the number of cases generated by each source case, data management through
- Severity of disease
- Manual calculation of CFR and hospitalisation ratio
- Projection of hospital bed requirements
EpiNow2to calculate average hospitalisation duration and forecasting
- Zoonotic transmission of disease
- Superspreading
- Calculation of attack rate
- Unable to calculate, given the lack of seroprevalence data
| Data analysis step | Challenges |
|---|---|
| Data anonymisation | Dealing with typos and missing data when generating random unique identifiers |
| Reproduction number | Right truncation Underestimation of cases due to reporting delays |
| Projection of hospital bed requirements | Incomplete data (missing discharge date) Undocumented functionality in R packages used |
| Zoonotic transmission | Poor documentation Unavailability of packages in R Differentiation between zoonotic transmission and risk factors- need for population data |
| Attack rate | Not enough information provided |
Scenario 3: Reston Ebolavirus in the Philippines
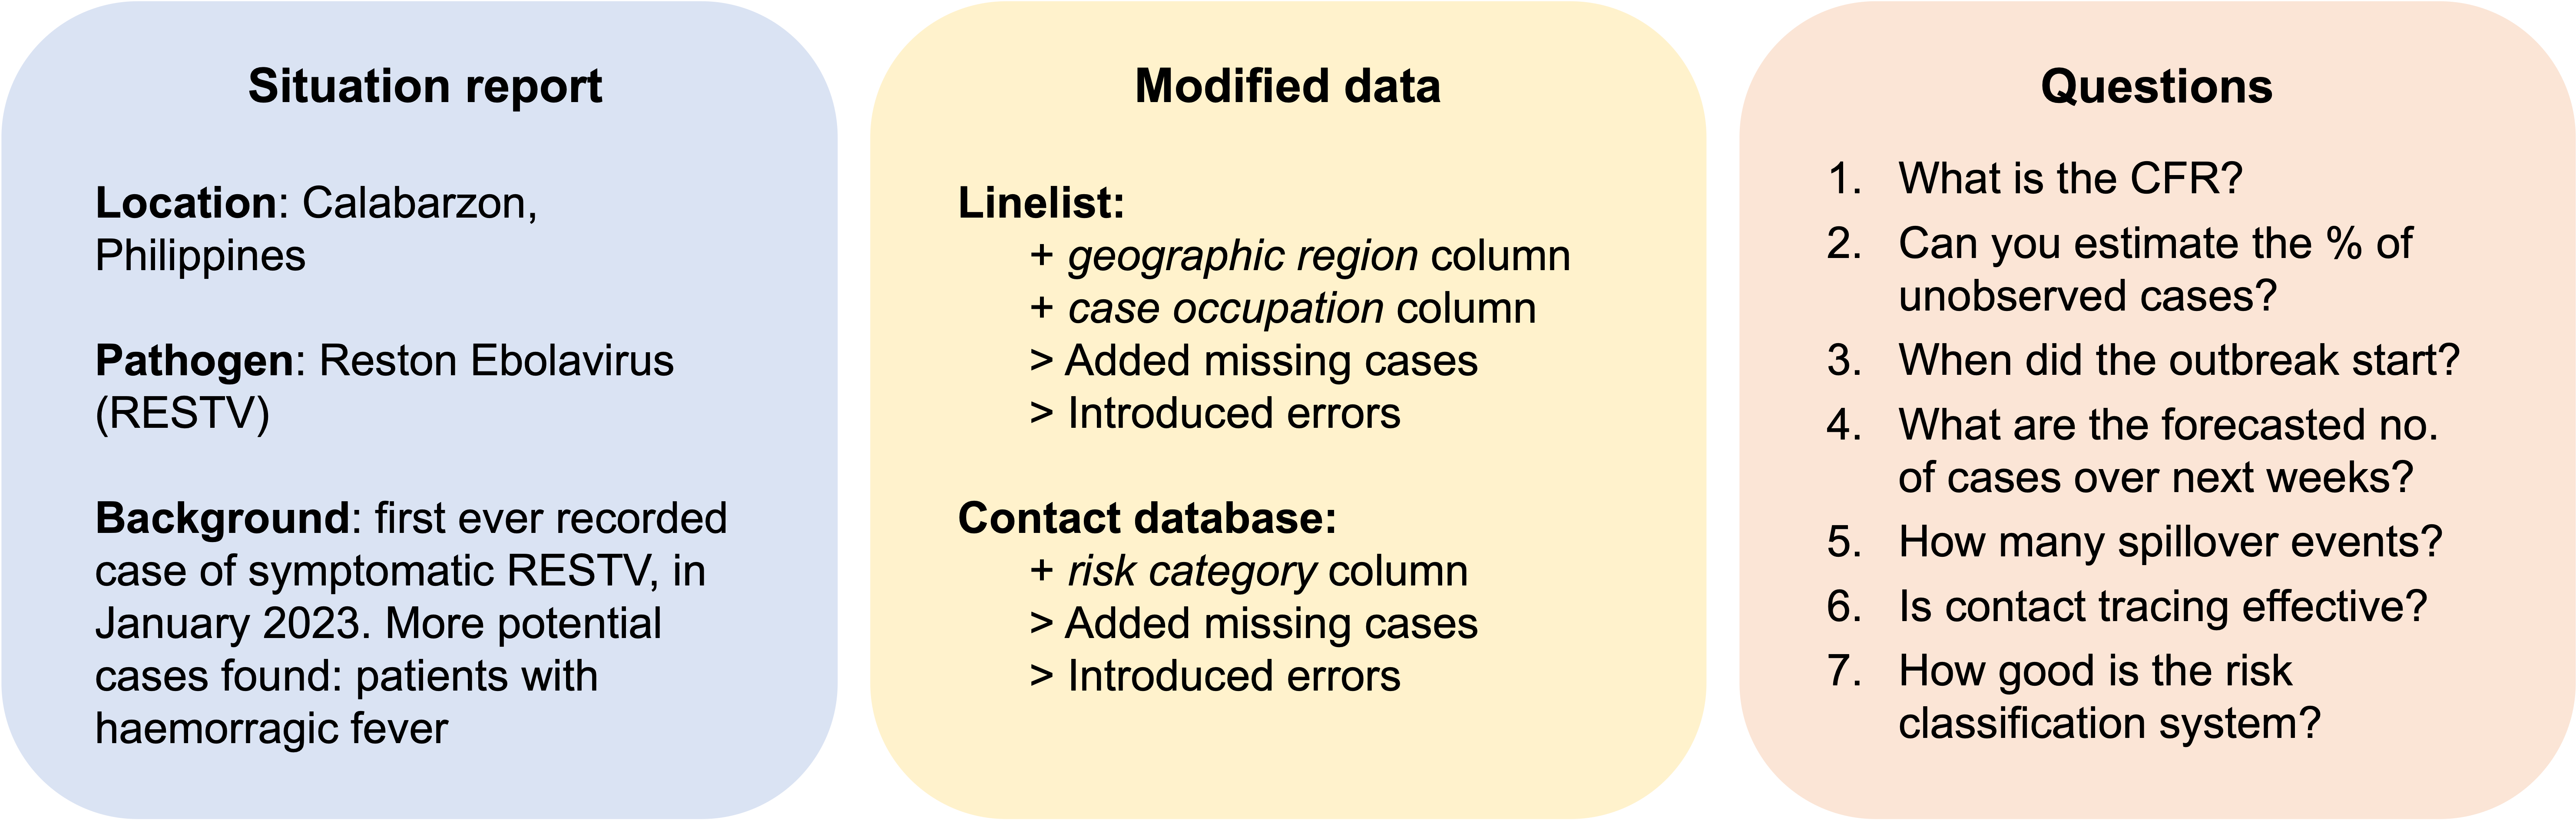
Analytic pipeline for scenario 3 (analysed by group 4)
- Data cleaning
- Importing data with
rio,readxl,readr, oropenxlsx - Rename variables with
janitor - Initial data checks with
pointblank,assertr,compareDF, orskimr - Vertical data checks with
matchmaker,lubridate, orparsedate - Horizontal data checks with
hmatch,assertr, orqueryR - Detect duplicates with
janitorandtidyverse - Checking for consistency with
dplyr, orpowerjoin - Translation with
matchmaker
- Importing data with
- Delay distributions
fitdistrplusto fit parameteric distributions to epidemic data
- Case demographics
- Outbreak description
sitrepto generate reports
- Visualisation of geographic data
- Generation of tables
- Severity of disease
- Attack rate
gadmfunction to get population dataepitabulateto describe datasfandggplot2to plot data
- Forecasting
- Spillover events
- By cross-referencing contact data with occupations
- Effectiveness of contact tracing
- By calculating the proportion of case follow-ups and comparing the delay of disease exposure to the follow-up delay
- Transmission trees
| Data analysis step | Challenges |
|---|---|
| Detection of outliers | No known tools to use |
| Severity of disease | Censoring |
| Spillover events | Missing data |
Scenario 4: Emerging avian influenza in Cambodia
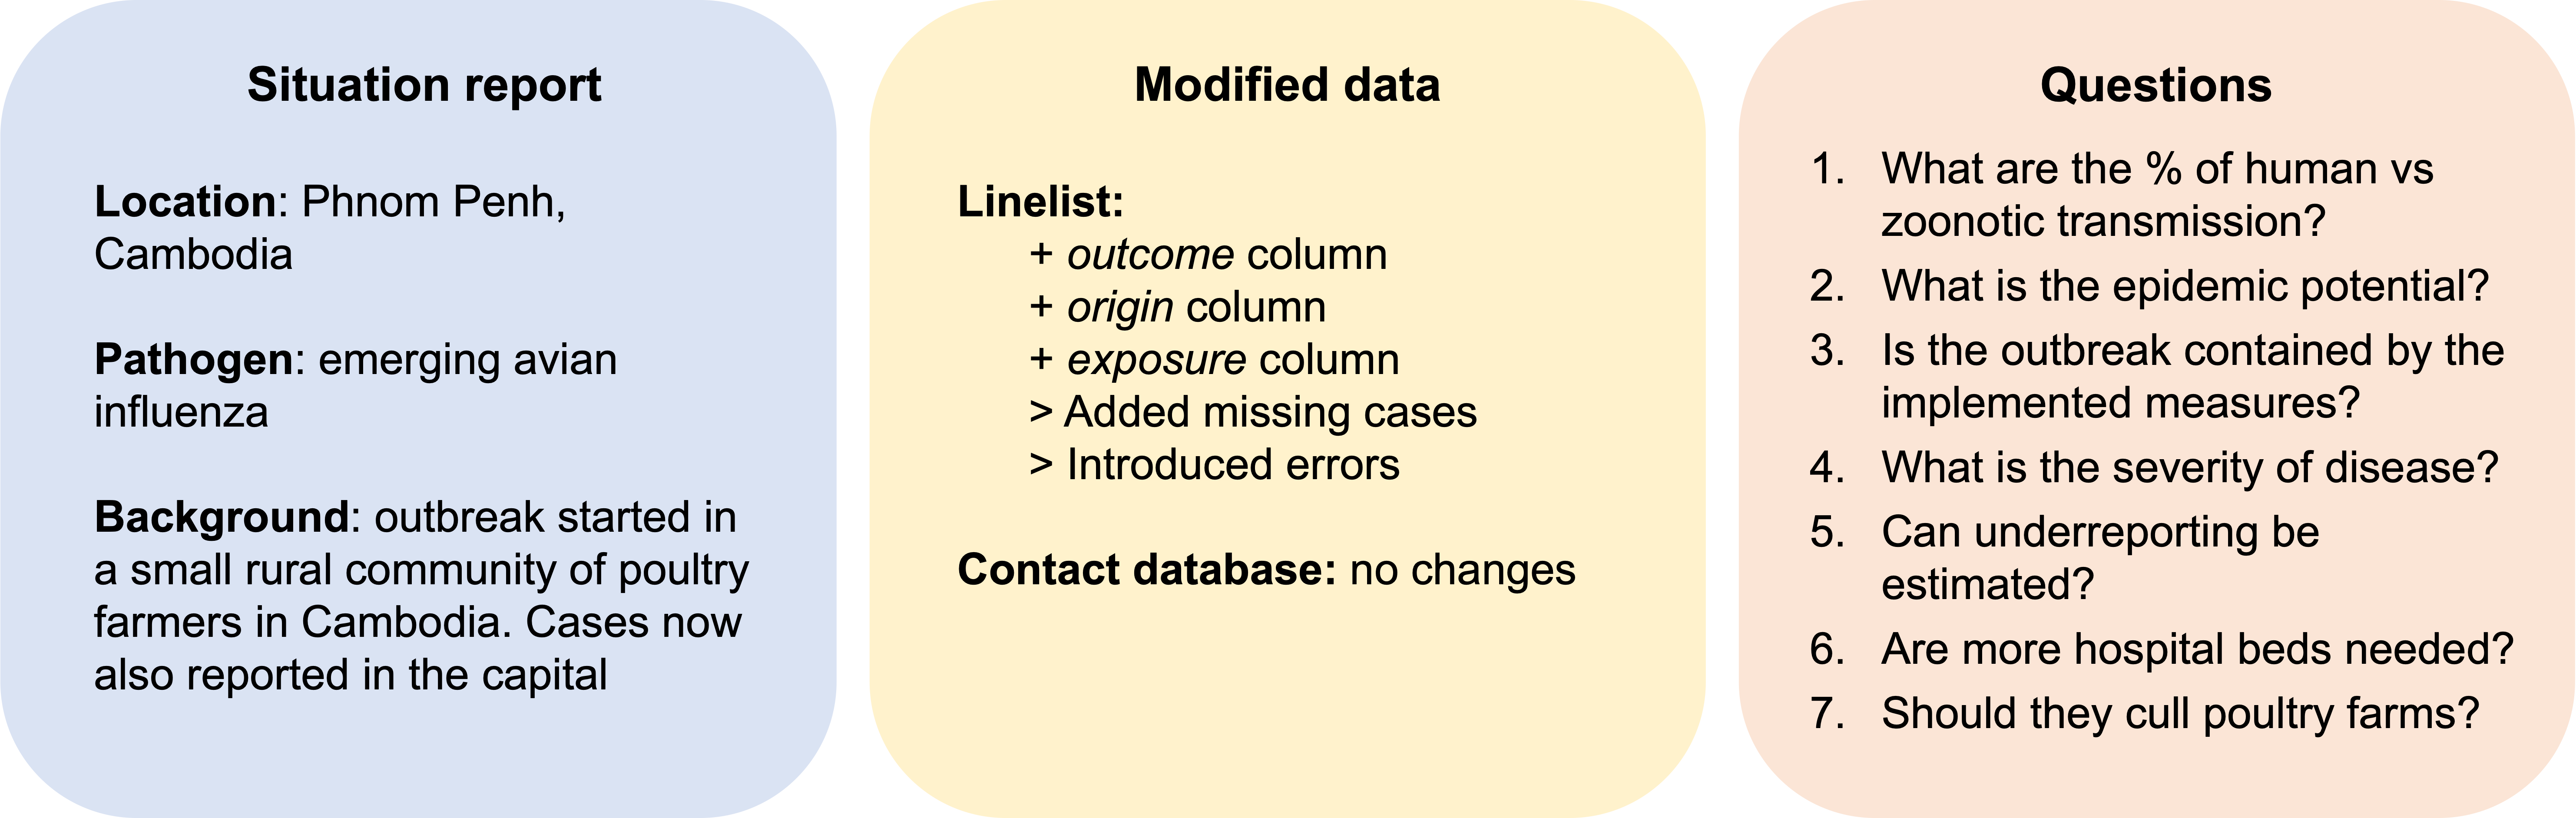
Analytic pipeline for scenario 4 (analysed by group 5)
- Data cleaning
- Reproduction number
- Severity of disease
- Manually using R to detect missing cases
epiRto check for data censoring
| Data analysis step | Challenges |
|---|---|
| Data cleaning | No available R packages specific for epidemic data |
| Reproduction number | Difficulty finding parameter estimations in the literature |
| Serial interval | Lack of a tool to check for parameter estimates |
| Severity | Missing cases Need for an R package for systematic censoring analysis |
Scenario 5: Outbreak of respiratory disease in Canada
Analytic pipeline for scenario 5 (analysed by group 1)
- Define project structure
- Defining the script’s structure with
cookiecutter,reportfactory, andorderly - Ensuring reproducibility of the analysis with iRODS and Git
- Working in a group with GitHub
- Defining the script’s structure with
- Data cleaning
- Delay distributions
epitrixfitdistrplusto fit parameteric distributions to scenario data
- Case demographics
apyramidto stratify data by age, gender, and health status
- Nowcasting
incidence2to visualise incidence from linelist dataepiparameterto extract infectious disease parameter dataEpiEstimorEpiNow2for Rt calculation
- Severity of disease
- Calculation of hospitalisation and mortality rates- no R package specified
- Zoonotic transmission
- Generation of reports
incidencefor static reports- Quarto and R markdown for dashboards
| Data analysis step | Challenges |
|---|---|
| Project structure | Working simultaneously on the same script and managing parallel tasks Anticipating future incoming data in early pipeline design |
| Data cleaning | Large amount of code lines used on (reasonably) predictable cleaning (e.g. data sense checks) Omitting too many data entries when simply removing NA rows Non standardised data formats Implementing rapid quality check reports before analysis |
| Delay distributions | Identifying the best method to calculate, or compare functionality of tools Need to fit multiple parametric distributions and return best, and store as usable objects |
| Severity of disease | Censoring and truncation Underestimation of mild cases Need database of age/gender pyramids for comparisons |
| Forecasts | Need option for fitting with range of plausible pathogen serial intervals and comparing results Changing reporting delays over time Matching inputs/outputs between packages |
| Zoonotic transmisison | Need for specific packages with clear documentation How to compare simple trend-based forecasts |
What next?
Scenarios developed by the 100 days workshop participants illustrate that there are many commonalities across proposed analytics pipelines, which could support interoperability across different epidemiological questions. However, there are also several remaining gaps and challenges, which creates an opportunity to build on existing work to tackle common outbreak scenarios, using the issues here as a starting point. This will also require consideration of wider interactions with existing software ecosystems and users of outbreak analytics insights. We are therefore planning to follow up this vignette with a more detailed perspective article discussing potential for broader progress in developing a ‘first 100 lines of code’.
List of contributors
- Group 1: Rich Fitzjohn, Mauricio Santos Vega, Andrea Torneri, Abdoelnaser Degoot, Rolina van Gaalen, Zulma Cucunuba, Joseph Tsui, Claudine Lim, Adam Kucharski.
- Group 2: Juan Daniel Umaña, Joel Hellewell, Anne Cori, Fanck Kalala, Amrish Baidjoe, Sara Hollis, Chaoran Chen, Pratik Gupte, Andree Valle.
- Group 3: Mutono Nyamai, Finlay Campbell, Arminder Deol, Simone Carter, Anita Shah, Neale Batra, Issa Karambal, Danil Mihailov, Sebastian Funk.
- Group 4: Anton Camacho, Louise Dyson, Jeremy Bingham, Simon Cauchemez, Alex Spina, Esther Van Kleef, Anna Carnegie, James Azam.
- Group 5: Olivia Keiser, Geraldine Gomez, John Lees, Don Klinkenberg, Matthew Biggerstaff, David Santiago Quevedo, Joshua Lambert, Carmen Tamayo.
Reuse
Citation
@online{tamayo2023,
  author = {Tamayo, Carmen},
  title = {What {Should} the {First} 100 {Lines} of {Code} {Written}
    {During} an {Epidemic} {Look} {Like?}},
  date = {2023-03-09},
  url = {https://epiverse-trace.github.io/posts/100days-workshop/},
  langid = {en}
}