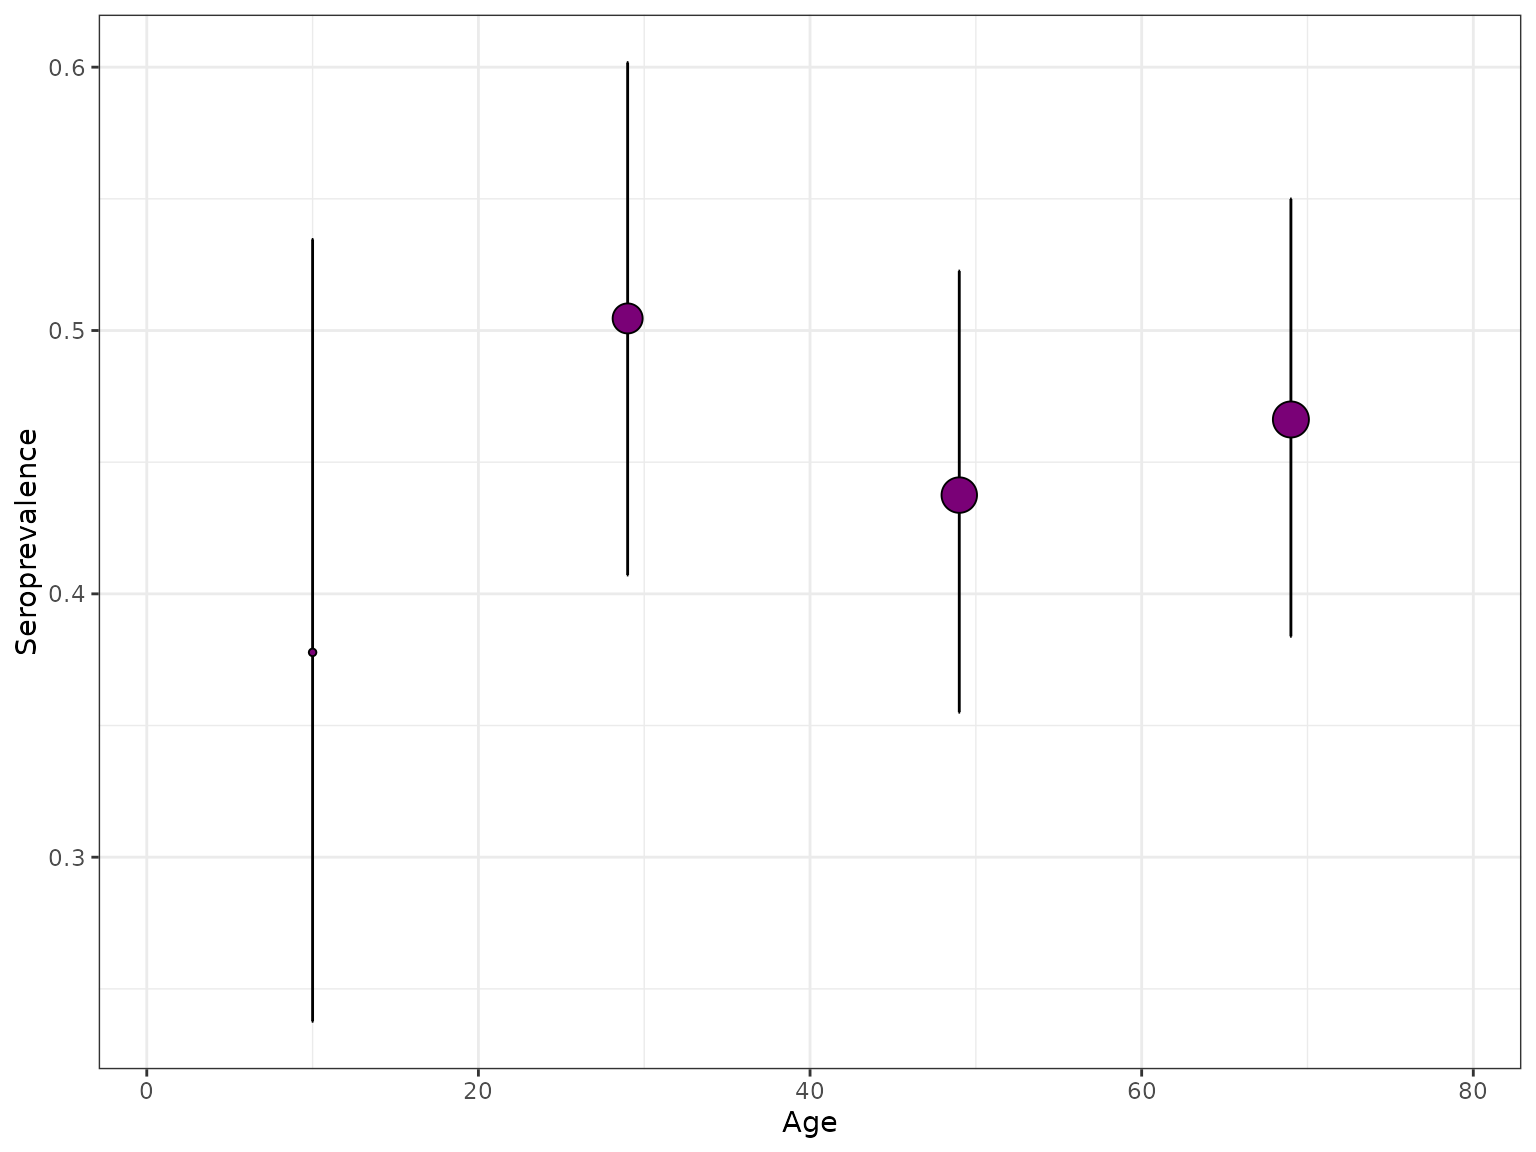
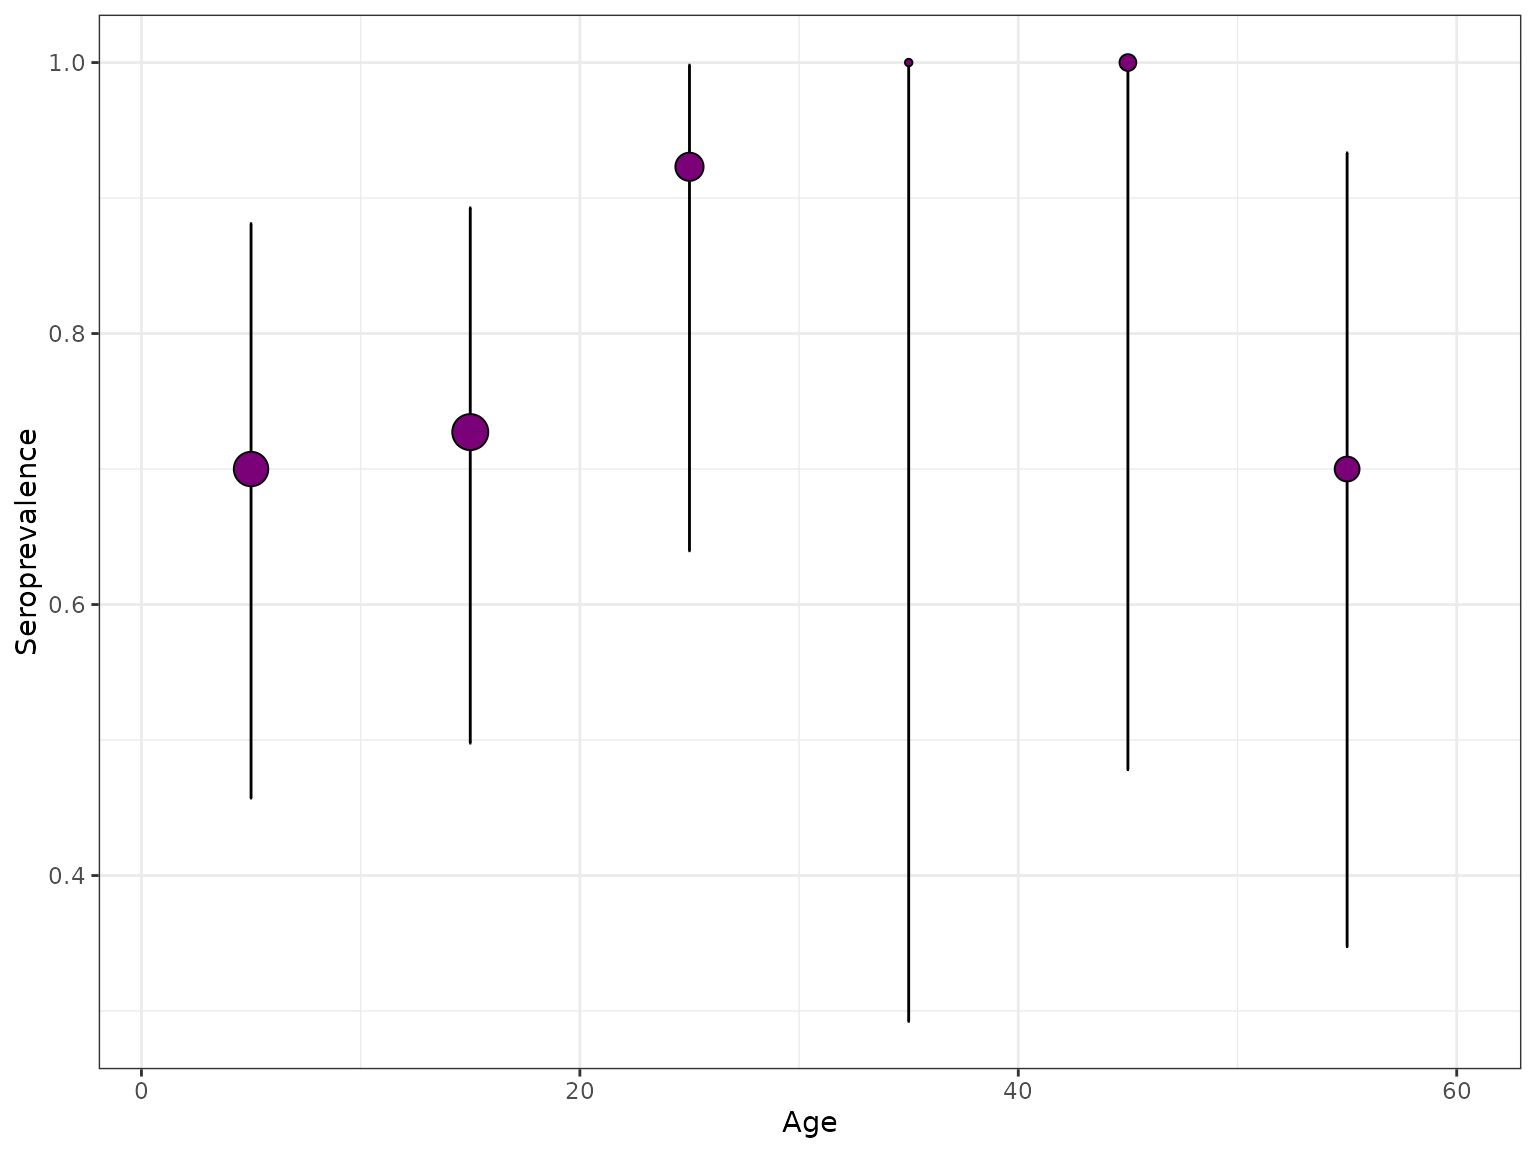
Plots seroprevalence from the given serosurvey
Arguments
- serosurvey
survey_yearYear in which the survey took place (only needed to plot time models)
age_minFloor value of the average between age_min and age_max
age_maxThe size of the sample
n_sampleNumber of samples for each age group
n_seropositiveNumber of positive samples for each age group
- size_text
Size of text for plotting (
base_sizein ggplot2)- bin_serosurvey
If
TRUE,serodatais binned by means ofprepare_bin_serosurvey. Otherwise, age groups are kept as originally input.- bin_step
Integer specifying the age groups bin size to be used when
bin_serosurveyis set toTRUE.