serofoi: force-of-infection from population based serosurveys with age-disaggregated data 
serofoi is an R package to estimate the Force-of-Infection (FoI) of a given pathogen from age-disaggregated population-based cross-sectional serosurveys, using a Bayesian framework. The package provides a set of features for assessing model fitting, convergence and visualisation.
serofoi relies on the rstan package, which provides an R interface for the Stan programming language for statistical Bayesian modelling. Particularly, serofoi relies on the use of a Hamiltonian Monte Carlo (HMC) algorithm implemented by Stan for Markov chain Monte Carlo (MCMC) sampling. The implemented methods are outlined in (Cucunubá et al. 2017) and (Carrera et al. 2020) (see FoI Models for further details). A compelling mathematical treatment of the implemented serocatalytic models can be found in (Kamau et al. 2025).
serofoi is part of the Epiverse Initiative.
Installation
You can install serofoi from CRAN using:
install.packages("serofoi")You can install the development version of serofoi from GitHub running:
if(!require("pak")) install.packages("pak")
pak::pak("epiverse-trace/serofoi")
or:
if(!require("remotes")) install.packages("remotes")
remotes::install_github("epiverse-trace/serofoi")
Quick start
serofoi provides some minimal serosurvey datasets that can be used to test out the package. For instance, the dataset chagas2012 contains seroprevalence measures of IgG antibodies against Trypanosoma cruzi infection corresponding to a serological survey conducted in Colombia during 2012 on a rural indigenous community that is known to present long-term endemic transmission
# Load example dataset chagas2012 included with the package
data(chagas2012)
head(chagas2012, 5)
#>   survey_year n_sample n_seropositive age_min age_max
#> 1        2012       34              0       1       1
#> 2        2012       25              0       2       2
#> 3        2012       35              1       3       3
#> 4        2012       29              0       4       4
#> 5        2012       36              0       5       5
A visualisation of the serological data can be obtained using the function plot_serosurvey:
plot_serosurvey(chagas2012, bin_serosurvey = TRUE, size_text = 15)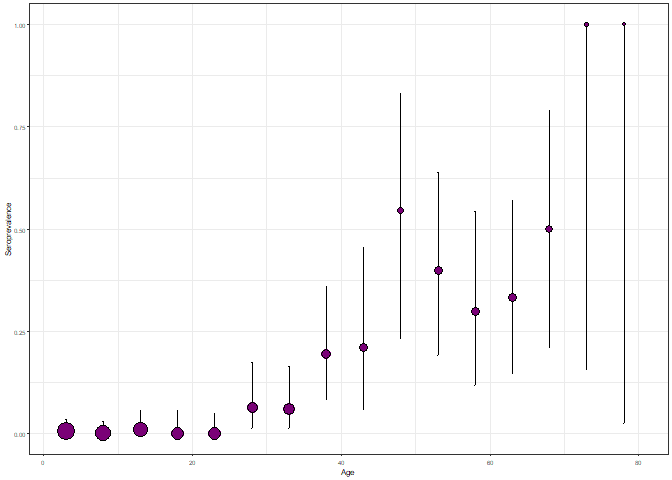
Seroprevalence plot for the chagas2012 dataset.
Here, the error bars correspond to the binomial confidence interval and the point size represents the sample size for each age group.
A constant FoI model can easily be implemented by means of fit_seromodel:
seromodel <- fit_seromodel(serosurvey = chagas2012)For further details on how to visualise the results and other available models, please refer to the online documentation.
Contributions
Contributors to the project include:
Zulma M. Cucunubá (author, maintainer)
Nicolás Torres (author)
Ben Lambert (author)
Pierre Nouvellet (author)
Geraldine Gómez (contributor)
Jaime A. Pavlich-Mariscal (contributor)
Miguel Gamez (contributor)
Hugo Gruson (contributor)
David Santiago Quevedo (contributor)
Everlyn Kamau (contributor)
Richard Creswell (contributor)
Sumali Bajaj (contributor)
Package vignettes
More details on how to use serofoi can be found in the online documentation as package vignettes, under “Articles”.
Help
To report a bug please open an issue.
Contribute
Contributions to serofoi are welcomed. Please follow the package contributing guide.
Code of conduct
Please note that the serofoi project is released with a Contributor Code of Conduct. By contributing to this project, you agree to abide by its terms.