Comparing vaccination strategies
Last updated on 2026-07-21 | Edit this page
Estimated time: 70 minutes
Overview
Questions
- What are the direct and indirect effects of vaccination?
- What are the benefits of targeted vaccination programs?
- What happens if we combine vaccination and NPIs?
Objectives
- Understand the potential impact of vaccination programs
- Implement vaccination programs and NPI measures simultaneously using
{epidemics}
- Complete tutorials Simulating transmission, Modelling interventions and Comparing public health outcomes of interventions.
Learners should familiarise themselves with the following concept dependencies before working through this tutorial:
Outbreak response: Intervention types.
Introduction
Vaccine programs can be used to help control epidemics via direct and indirect protection from infection. We can use mathematical models to make predictions about the potential impact of different vaccination strategies.
Depending on how infections spread, targeting specific risk groups for vaccination may be a more effective strategy than vaccinating everyone. When vaccine programs are not immediately available to be rolled out, either from a capacity or development perspective, we may also want to know how non-pharmaceutical interventions (NPIs) can be used to control the epidemic in the meantime, as well as after a vaccine program has started.
In this tutorial we will compare different vaccination strategies
using models from {epidemics}. We will use the following R
packages:
R
library(ggplot2)
library(epidemics)
library(contactsurveys)
library(socialmixr)
library(wpp2024)
library(dplyr)
library(purrr)
Key Terms
Before proceeding, let’s define some important terms:
- Herd immunity: A form of indirect protection from infectious disease that occurs when a sufficient proportion of a population has become immune to an infection, thereby reducing the likelihood of infection for individuals who lack immunity.
- Vaccination strategies: Different approaches to administering vaccines, which may include targeting specific age groups or risk populations.
- Non-pharmaceutical interventions (NPIs): Actions, apart from vaccines and treaments, that people and communities can take to help slow the spread of illnesses.
Direct and indirect effects of vaccination
Vaccination programs using infection-blocking vaccines have two benefits:
- Reducing individual risk of infection (direct effect of vaccination)
- Reducing onward contribution to transmission (indirect effect of vaccination).
We will illustrate this using results from
model_default() in {epidemics}. The
model_default() function implements a standard SEIR
(Susceptible-Exposed-Infected-Recovered) model with vaccination
compartments. Using the contact matrix and parameters from the COVID-19
outbreak example in Modelling
interventions we will investigate the impact of two vaccination
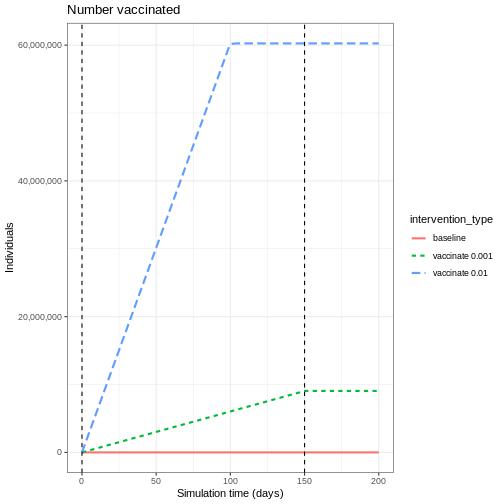
programs on the number of infections. For this hypothetical scenario, we
will assume that vaccination programs start on day 0 and continue to be
in place for 150 days. We will assume all age groups are vaccinated at
the same rate in each program as follows:
- vaccination program 01: vaccination rate 0.001
- vaccination program 02: vaccination rate 0.01.
R
# prepare vaccination objects
vaccinate_01 <- epidemics::vaccination(
  name = "vaccinate all",
  time_begin = matrix(0, nrow(contacts_byage_matrix)),
  time_end = matrix(150, nrow(contacts_byage_matrix)),
  nu = matrix(c(0.001, 0.001, 0.001))
)

vaccinate_02 <- epidemics::vaccination(
  name = "vaccinate all",
  time_begin = matrix(0, nrow(contacts_byage_matrix)),
  time_end = matrix(150, nrow(contacts_byage_matrix)),
  nu = matrix(c(0.01, 0.01, 0.01))
)
We see the intuitive result that the higher the vaccination rate, the more people that are vaccinated.
To understand the indirect effect of vaccinations,
we want to know the effect that vaccination has on transmission, and
hence the rate at new infections occur. We will use the function
new_infections() in {epidemics} to calculate
the number of new infections over time for the different vaccination
programs.
The inputs required are:
-
data: the model output, -
exclude_compartments: this is an optional input, but in our case needed. We don’t want the number of people vaccinated to be counted as new infections, so we need to specify the name of the model compartment where individuals transition out fromsusceptible(in this examplevaccinated), -
by_group: should the results be calculated for each demographic group separately.
R
vaccinate_01_infections <- epidemics::new_infections(
  output_vaccinate_01,
  exclude_compartments = "vaccinated",
  by_group = FALSE
)
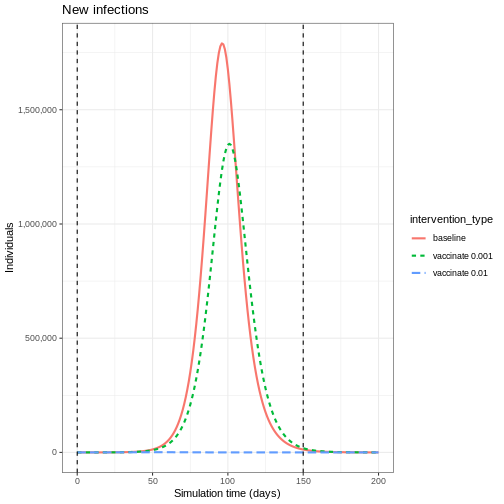
We see that after accounting for the number of people vaccinated, there are fewer new infections when you have a higher vaccination rate. This is because there are fewer people susceptible to infection, and therefore fewer people who can become infected and contribute to onward infection.
This indirect effect of vaccination programs is key to successfully controlling and eradicating infections.
To evaluate the impact of vaccination programs, we often consider both the peak size, which indicates healthcare pressure at a single point in time, and the overall epidemic size, which refers to the cumulative number of infections.
We can find the cumulative sum using the R function
cumsum() and use purrr::map_dfr() to loop over
a list of new infection data frames. We can see the difference in
infection numbers is by several orders of magnitude.
R
# create function that returns the intervention type and cumulative sum for
# given infections
find_cumsum <- function(infections) {
  return(data.frame(
    intervention_type = unique(infections$intervention_type),
    cumulative_sum = tail(cumsum(infections$new_infections), n = 1)
  ))
}

# create list of interventions
interventions <- tibble::lst(
  baseline_infections,
  vaccinate_01_infections,
  vaccinate_02_infections
)

# apply function to each data frame in the list
purrr::map_dfr(interventions, find_cumsum)
OUTPUT
  intervention_type cumulative_sum
1          baseline    59329638.86
2   vaccinate 0.001    49654981.57
3 vaccinate 0.01 38229.64Herd immunity threshold
There exists a target threshold of vaccination based on the basic reproduction number \(R_0\) to achieve herd immunity.
The proportion of the population (\(p\)) that needs to be immune to achieve herd immunity is:
\[p = 1- \frac{1}{R_0}. \]
This formula is derived from the concept that when a sufficient proportion of the population is immune, each infected person will transmit the infection to fewer than one other person on average, leading to a decline in cases. For details of the mathematical derivation check out this Plus Magazine article.
Targeted vaccination
For infections that have a higher burden in different risk groups, targeted vaccination programs can be utilised to control infection. For example, if there is heterogeneity in contacts by age, targeting different age groups for vaccination will result in different disease trajectories.
We will use the same contact matrix as above from Modelling interventions:
R
contacts_byage_matrix
OUTPUT
          contact.age.group
age.group     [0,15)  [15,65)  [65,Inf)
  [0,15)   6.8461538 5.955517 0.5902511
  [15,65)  1.6849927 9.169207 1.1489409
  [65,Inf) 0.5677992 3.906404 1.7142857
There is higher levels of mixing within the 0-15 and 15-65 age groups than in the 65+ age group, so we expect that targeting different age groups will result in different disease trajectories.
To show the effect of targeted vaccination, we will compare the following scenarios:
- vaccinating all age groups at a rate 0.001,
- vaccinating ages 0-15 only (group 1) at a rate 0.003,
- vaccinating ages 15-65 only (group 2) at a rate 0.003,
- vaccinating ages 65+ only (group 3) at a rate 0.003.
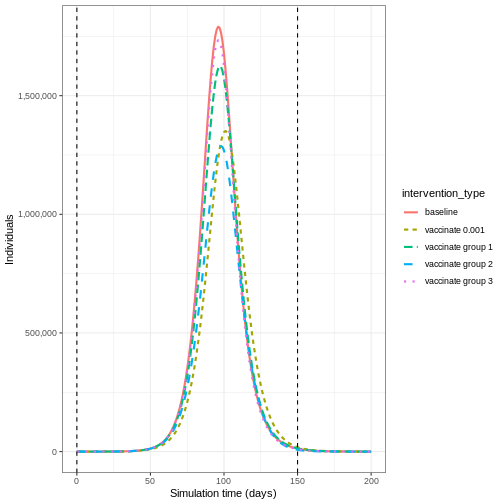
Vaccinating group 3 only results in the highest epidemic peak size. Targeting group 2 results in the smallest epidemic peak size. Whereas targeting all age groups pushes the epidemic peak time later. As before, let’s compare the cumulative number of infections under the different interventions:
R
interventions_targetted <- tibble::lst(
  baseline_infections,
  vaccinate_01_infections,
  vaccinate_group_1_infections,
  vaccinate_group_2_infections,
  vaccinate_group_3_infections
)

# apply function to each data frame in the list
purrr::map_dfr(interventions_targetted, find_cumsum)
OUTPUT
intervention_type cumulative_sum
1 baseline 59329639
2 vaccinate 0.001 49654982
3 vaccinate group 1 55928759
4 vaccinate group 2 46866276
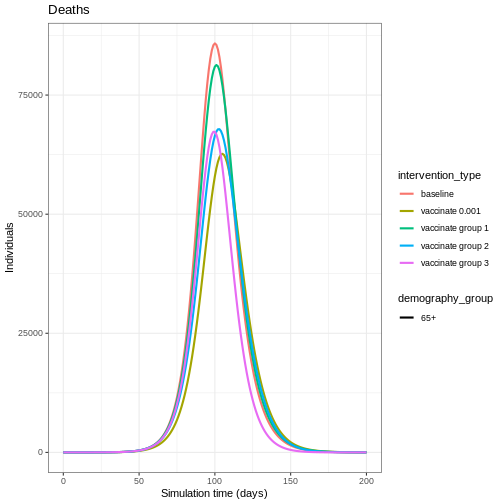
5 vaccinate group 3 57002959Age-specific infection-fatality-risk
Targeting specific age groups can reduce the number of deaths in the eldest age group. To illustrate this, we can define an age-specific infection-fatality-risk (IFR):
R
ifr <- c(0.00001, 0.001, 0.4)
names(ifr) <- rownames(contacts_byage_matrix)
To convert infections to deaths, we will need new infections by age
group, so we call new_infections() with
by_group = TRUE and then multiply the new infections by the
IFR for that age group:
R
vaccinate_group_1_age <- epidemics::new_infections(
  output_vaccinate_group_1,
  exclude_compartments = "vaccinated",
  by_group = TRUE
)

vaccinate_group_1_deaths <-
  1:3 %>%
  purrr::map_dfr(
    function(x)
      vaccinate_group_1_age %>%
        filter(demography_group == names(ifr)[x]) %>%
        mutate(deaths = new_infections * ifr[x])
  )
Vaccinating all age groups has the greatest impact on deaths in the eldest age group (over 65 years of age), but we also see that vaccinating group 2 reduces the deaths in the eldest age group. Targeting younger groups can the number of deaths in the eldest age group (over 65 years of age).
R
baseline_deaths$intervention_type  <- "baseline"
vaccinate_01_deaths$intervention_type  <- "vaccinate 0.001"
vaccinate_group_1_deaths$intervention_type  <- "vaccinate group 1"
vaccinate_group_2_deaths$intervention_type  <- "vaccinate group 2"
vaccinate_group_3_deaths$intervention_type  <- "vaccinate group 3"

output_deaths <- rbind(baseline_deaths,
                       vaccinate_01_deaths,
                       vaccinate_group_1_deaths,
                       vaccinate_group_2_deaths,
                       vaccinate_group_3_deaths)

output_deaths %>%
  filter(demography_group == "[65,Inf)") %>%
  ggplot() +
  ggtitle("Deaths") +
  geom_line(
            aes(time,
              deaths,
              colour = intervention_type,
              linetype = demography_group
            ),
            linewidth = 1) +
  theme_bw() +
  labs(
    x = "Simulation time (days)",
    y = "Individuals"
  )
Vaccination versus NPIs
Modelling is a useful tool for understanding the potential impact of the timing and different combinations of control measures. In an outbreak scenario, vaccines can be used alongside other control measures. A recent study by Barnsley et al. (2024) used modelling to show the impact the COVID-19 vaccine could have had alongside NPIs if the vaccine had been developed within 100 days of the pathogen threat being recognised. We will use this study as inspiration to show the impact of a vaccine versus NPI implemented at different times.
The NPI we will consider is temporarily closing schools, an intervention that has been used as a control measure for seasonal influenza (Cowling et al. 2008). Specifically, we will model a school closure that will reduce the contacts between school aged children (aged 0-15) by 0.5, and will cause a small reduction (0.01) in the contacts between adults (aged 15 and over). For the vaccine program, we assume an equal vaccination rate of 0.01 in each age group.
We define early implementation as the first day of the simulation (i.e. when there are less than 100 infections in total), and late implementation as 50 days after the start of the simulation (i.e. when there are approximately 50,000 infections in total). We assume the control measures are in place for 100 days after they start.
The combinations we will consider are:
- early implementation of closing schools,
- early implementation of a vaccine,
- late implementation of a vaccine,
- early implementation of closing schools and late implementation of a vaccine.
The code below details how the interventions are simulated:
R
early_start <- 0
late_start <- 50
duration <- 100
time_end <- 200

# close schools early
close_schools_early <- epidemics::intervention(
  name = "School closure",
  type = "contacts",
  time_begin = early_start,
  time_end = early_start + duration,
  reduction = matrix(c(0.5, 0.01, 0.01))
)

# vaccination late
vacc_late <- epidemics::vaccination(
  name = "vaccinate late",
  time_begin = matrix(late_start, nrow(contacts_byage_matrix)),
  time_end = matrix(late_start + duration, nrow(contacts_byage_matrix)),
  nu = matrix(c(0.01, 0.01, 0.01))
)

# npis started early + vaccination late
output_npi_early_vacc_late <- epidemics::model_default(
  population = uk_population,
  transmission_rate = transmission_rate,
  infectiousness_rate = infectiousness_rate,
  recovery_rate = recovery_rate,
  vaccination = vacc_late,
  intervention = list(contacts = close_schools_early),
  time_end = time_end, increment = 1.0
)
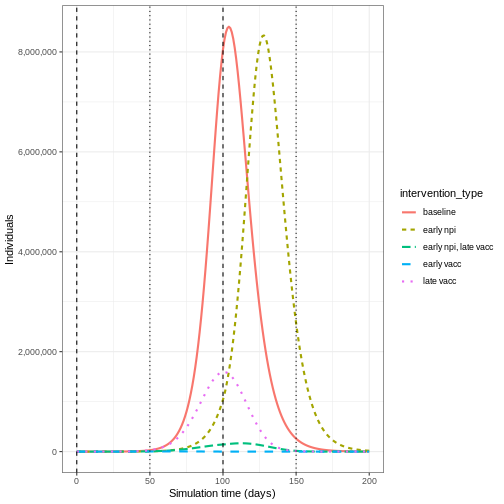
Early implementation of NPIs (early npi) delays the
timing of the peak of infectious individuals but does not decrease the
magnitude by much once the measure is lifted. Early implementation of
the vaccine (early vacc) is the most effective control for
reducing the peak number of infectious individuals, because it reduces
the size of the susceptible group rather than just temporarily keeping
infections away from it. Having an NPI in place before the vaccine is
implemented (early npi, late vacc) is more effective than
simply just implementing the vaccine late (late vacc).
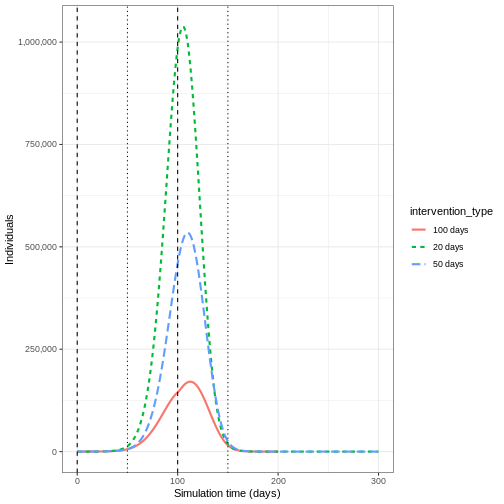
Lifting NPI measures
Investigate the impact lifting the after implementing the vaccine. Adapt the code below to lift the NPI after 20, 50 and 100 days
R
duration_20 <- 20
duration_50 <- 50

close_schools_early_20 <- epidemics::intervention(
  name = "School closure",
  type = "contacts",
  time_begin = early_start,
  time_end = early_start + duration_20,
  reduction = matrix(c(0.5, 0.01, 0.01))
)

close_schools_early_50 <- epidemics::intervention(
  name = "School closure",
  type = "contacts",
  time_begin = early_start,
  time_end = early_start + duration_50,
  reduction = matrix(c(0.5, 0.01, 0.01))
)

output_npi_early_vacc_late_20 <- epidemics::model_default(
  population = uk_population,
  transmission_rate = transmission_rate,
  infectiousness_rate = infectiousness_rate,
  recovery_rate = recovery_rate,
  vaccination = vacc_late,
  intervention = list(contacts = close_schools_early_20),
  time_end = 300, increment = 1.0
)

output_npi_early_vacc_late_50 <- epidemics::model_default(
  population = uk_population,
  transmission_rate = transmission_rate,
  infectiousness_rate = infectiousness_rate,
  recovery_rate = recovery_rate,
  vaccination = vacc_late,
  intervention = list(contacts = close_schools_early_50),
  time_end = 300, increment = 1.0
)

output_npi_early_vacc_late_20$intervention_type <- "20 days"
output_npi_early_vacc_late_50$intervention_type <- "50 days"
output_npi_early_vacc_late$intervention_type <- "100 days"

output_npis <- rbind(output_npi_early_vacc_late_20,
                     output_npi_early_vacc_late_50,
                     output_npi_early_vacc_late)

output_npis %>%
  filter(compartment == "infectious") %>%
  ggplot() +
  aes(
    x = time,
    y = value,
    color = intervention_type,
    linetype = intervention_type
  ) +
  stat_summary(
    fun = "sum",
    geom = "line",
    linewidth = 1
  ) +
  scale_y_continuous(
    labels = scales::comma
  ) +
  geom_vline(
    xintercept = c(
      early_start,
      early_start + duration
    ),
    linetype = 2
  ) +
  geom_vline(
    xintercept = c(
      late_start,
      late_start + duration
    ),
    linetype = 3
  ) +
  theme_bw() +
  labs(
    x = "Simulation time (days)",
    y = "Individuals"
  )
Summary
Using model generated disease trajectories we have investigated the potential impact of different vaccination strategies. When infection has group specific risk, targeted vaccination programs may be more effective in reducing epidemic peak. NPIs can be used alongside vaccine development to delay epidemic peaks before vaccines are readily available.
We used a SEIR model with a vaccination class, but if we modelled immunity to infection then we could investigate the impact of a vaccination program if it was implemented very late in the epidemic (i.e. after post-infection immunity had accumulated). See for example, Baguelin et al. 2010
In this tutorial we have investigated the potential effect of infection blocking vaccines, but we can use models to explore other effects of vaccines including imperfect vaccines. The disease trajectories generated in this tutorial can be used to calculate measures such as DALYs averted as part of health economic analyses.
- Herd immunity is a indirect effect of vaccination programs
- Targeted vaccination programs have benefits when there is heterogeneity in contacts
- The timing of implementation of vaccination programs and NPIs can result in very different disease trajectories