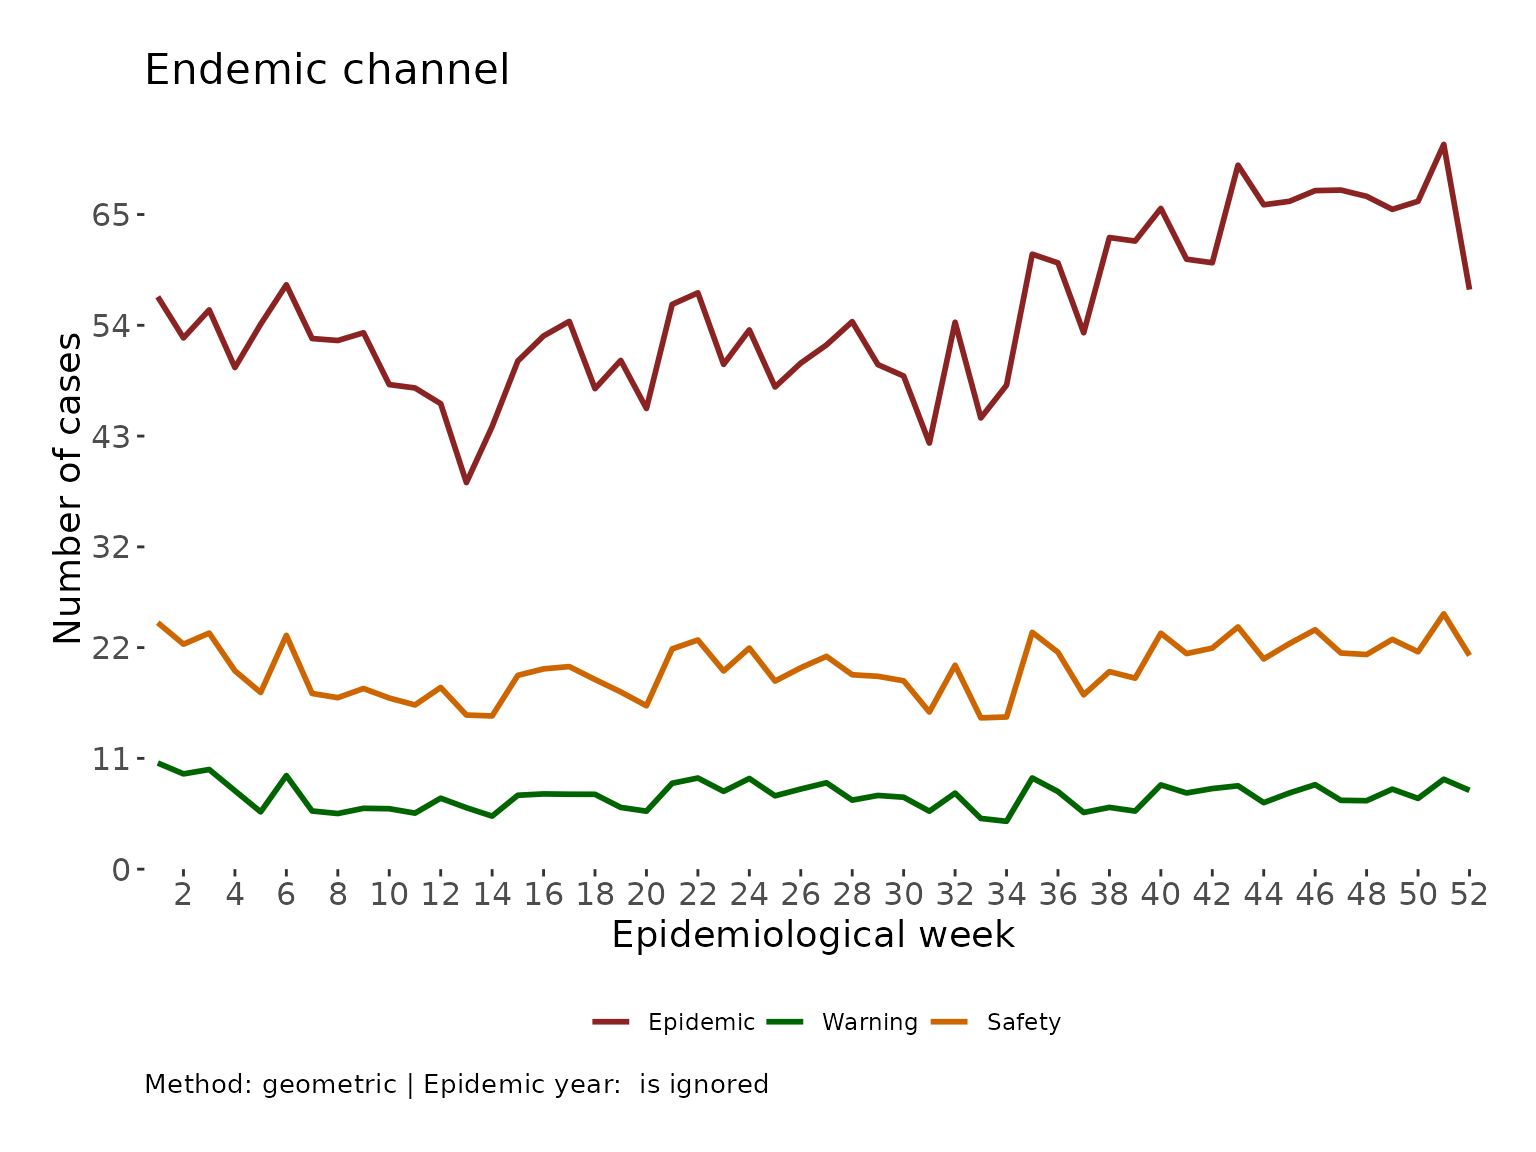
Create and return the endemic channel of a disease from an incidence object
Source:R/endemic_channel.R
endemic_channel.RdFunction that builds the endemic channel of a disease time series based on the selected method and windows of observation
Usage
endemic_channel(
  incidence_historic,
  observations = NULL,
  method = c("geometric", "median", "mean", "unusual_behavior"),
  geometric_method = "shifted",
  outlier_years = NULL,
  outliers_handling = c("ignored", "included", "replaced_by_median", "replaced_by_mean",
    "replaced_by_geometric_mean"),
  ci = 0.95,
  plot = FALSE
)
Arguments
- incidence_historic
An incidence object with the historic weekly observations
- observations
A numeric vector with the current observations
- method
A string with the mean calculation method of preference (median, mean, or geometric) or to use the unusual behavior method (Poisson Distribution Test for Hypoendemic settings)
- geometric_method
A string with the selected method for geometric mean calculation; see: geometric_mean
- outlier_years
A numeric vector with the outlier years
- outliers_handling
A string with the handling decision regarding outlier years, see: outliers_handling function
- ci
= 0.95 A numeric value to specify the confidence interval to use with the geometric method
- plot
A boolean for displaying a plot
Examples
data_event <- epiCo::epi_data
data_ibague <- data_event[data_event$cod_mun_o == 73001, ]
incidence_historic <- incidence::incidence(data_ibague$fec_not,
  interval = "1 epiweek"
)
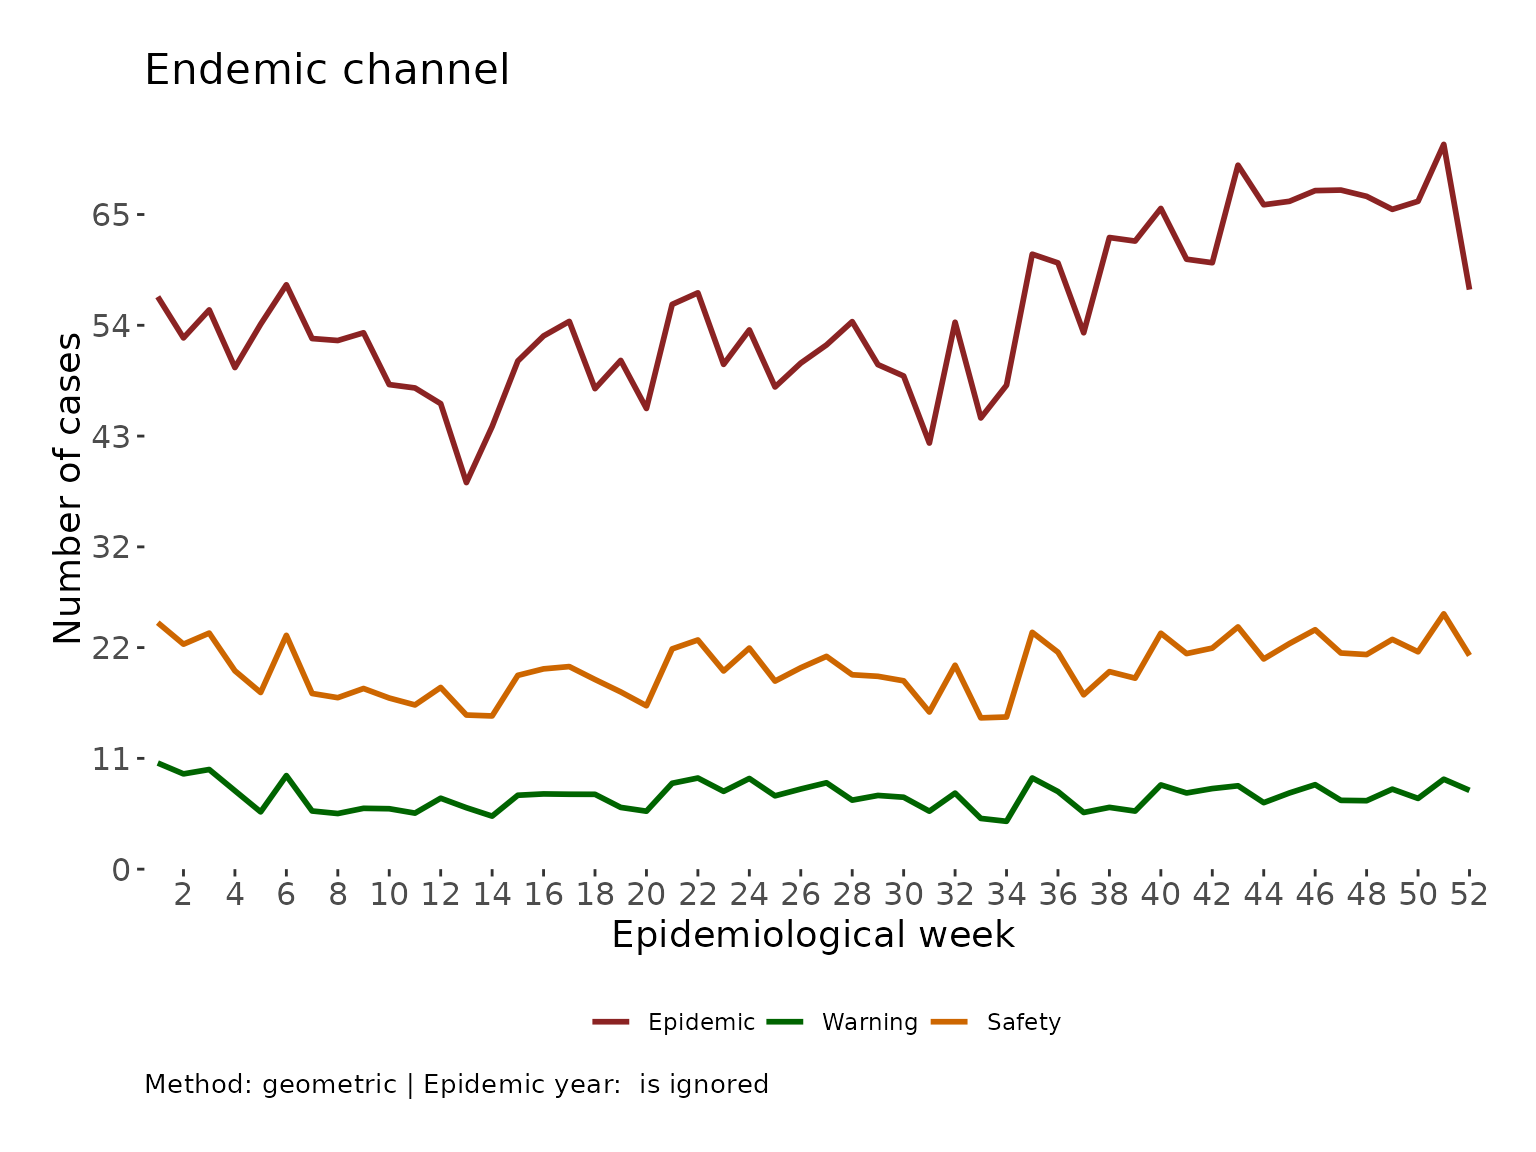
endemic_channel(incidence_historic,
  method = "geometric", plot = TRUE
)
#> Data after 2022-12-25 were not used for the endemic channel calculation.

#> $data
#>     central   up_lim   low_lim obs
#> 1  24.47382 56.83201 10.539270  NA
#> 2  22.33804 52.74742  9.459952  NA
#> 3  23.43837 55.52740  9.893443  NA
#> 4  19.69165 49.80177  7.786091  NA
#> 5  17.54179 54.10652  5.687196  NA
#> 6  23.21728 58.02311  9.290127  NA
#> 7  17.44415 52.68364  5.775955  NA
#> 8  17.02630 52.48901  5.522963  NA
#> 9  17.93639 53.25805  6.040666  NA
#> 10 16.99037 48.11213  5.999998  NA
#> 11 16.30440 47.77830  5.563896  NA
#> 12 18.04311 46.21868  7.043772  NA
#> 13 15.30253 38.38336  6.100753  NA
#> 14 15.21235 43.94540  5.265980  NA
#> 15 19.24401 50.45650  7.339627  NA
#> 16 19.88636 52.94265  7.469730  NA
#> 17 20.11381 54.38677  7.438673  NA
#> 18 18.82923 47.70870  7.431348  NA
#> 19 17.59734 50.51378  6.130334  NA
#> 20 16.22427 45.74133  5.754685  NA
#> 21 21.86827 56.07508  8.528231  NA
#> 22 22.75543 57.22492  9.048673  NA
#> 23 19.67685 50.11830  7.725291  NA
#> 24 21.95581 53.54033  9.003635  NA
#> 25 18.67200 47.87688  7.282086  NA
#> 26 19.99601 50.24641  7.957591  NA
#> 27 21.12839 52.04795  8.576878  NA
#> 28 19.30105 54.36276  6.852679  NA
#> 29 19.14772 50.09521  7.318767  NA
#> 30 18.70109 48.96618  7.142293  NA
#> 31 15.60288 42.30523  5.754605  NA
#> 32 20.24884 54.30387  7.550392  NA
#> 33 15.02208 44.79656  5.037505  NA
#> 34 15.10822 48.05064  4.750369  NA
#> 35 23.51291 61.06149  9.054102  NA
#> 36 21.53578 60.19264  7.705091  NA
#> 37 17.31170 53.25710  5.627324  NA
#> 38 19.61336 62.71382  6.133957  NA
#> 39 18.96260 62.36108  5.766100  NA
#> 40 23.42624 65.60374  8.365205  NA
#> 41 21.40414 60.56026  7.564980  NA
#> 42 21.94888 60.21215  8.000932  NA
#> 43 24.05417 69.89871  8.277736  NA
#> 44 20.86997 65.96651  6.602678  NA
#> 45 22.39830 66.30860  7.565894  NA
#> 46 23.77151 67.37194  8.387537  NA
#> 47 21.46182 67.42606  6.831331  NA
#> 48 21.30963 66.80371  6.797532  NA
#> 49 22.81365 65.51115  7.944642  NA
#> 50 21.58169 66.31157  7.023953  NA
#> 51 25.35126 71.96271  8.930826  NA
#> 52 21.21817 57.54274  7.823936  NA
#>
#> $plot

#>
#>