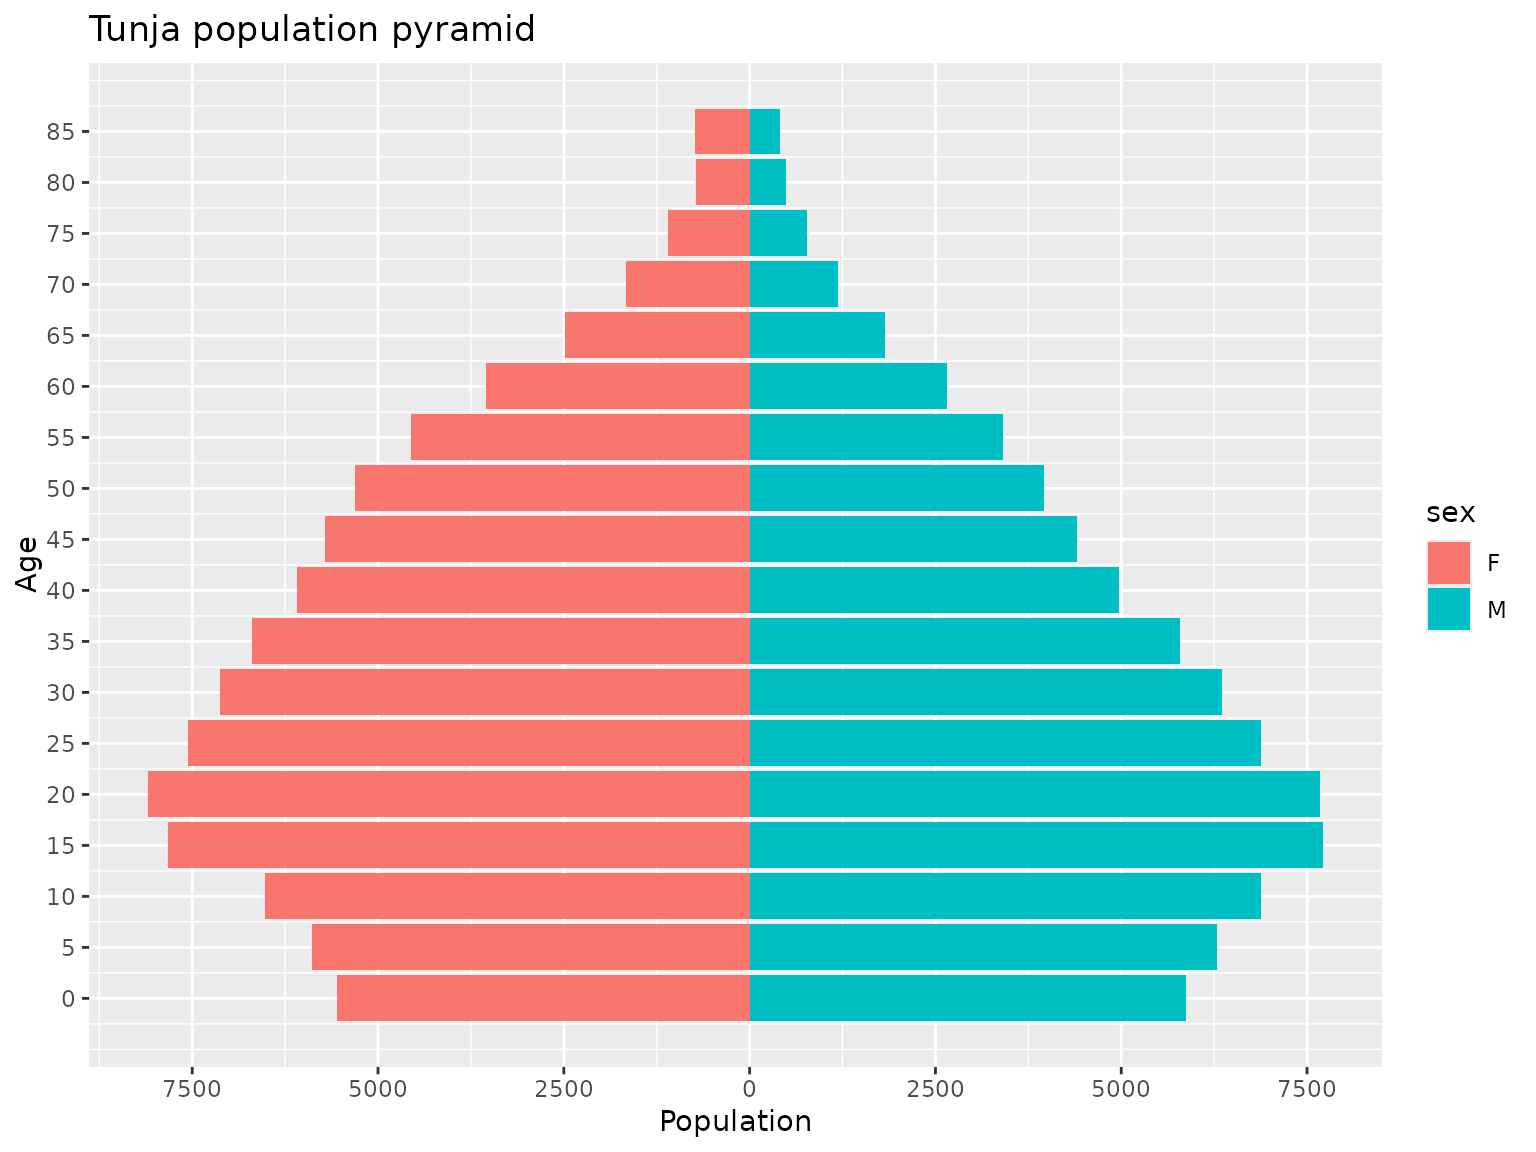
Returns the population pyramid of the consulted region
Source:R/demographics.R
population_pyramid.RdFunction that returns the population pyramid of the municipality or department of a specific year
Arguments
- divipola_code
A code from the divipola table representing a department or municipality. To obtain values at the national level, code '0' is used
- year
A numeric input for the year of interest
- sex
A boolean to consult data disaggregated by sex. The default value is TRUE
- range
A numeric value from 1 to 100 for the age range to use. The default value is 5
- total
A boolean for returning the total number rather than the proportion of the country's population. The default value is TRUE
- plot
A boolean for displaying a plot. The default value is TRUE
Examples
population_pyramid("15001", 2015, sex = TRUE, total = TRUE, plot = TRUE)

#> $data
#>    age population sex
#> 1    0       5553   F
#> 2    5       5890   F
#> 3   10       6527   F
#> 4   15       7820   F
#> 5   20       8095   F
#> 6   25       7558   F
#> 7   30       7125   F
#> 8   35       6694   F
#> 9   40       6085   F
#> 10  45       5707   F
#> 11  50       5304   F
#> 12  55       4557   F
#> 13  60       3546   F
#> 14  65       2484   F
#> 15  70       1670   F
#> 16  75       1099   F
#> 17  80        720   F
#> 18  85        730   F
#> 19   0       5867   M
#> 20   5       6291   M
#> 21  10       6882   M
#> 22  15       7721   M
#> 23  20       7673   M
#> 24  25       6880   M
#> 25  30       6357   M
#> 26  35       5795   M
#> 27  40       4966   M
#> 28  45       4409   M
#> 29  50       3962   M
#> 30  55       3403   M
#> 31  60       2662   M
#> 32  65       1819   M
#> 33  70       1183   M
#> 34  75        769   M
#> 35  80        483   M
#> 36  85        407   M
#>
#> $plot

#>
#>