Introduction to outbreak analytics
Figure 1
Figure 2
Figure 3
Figure 4
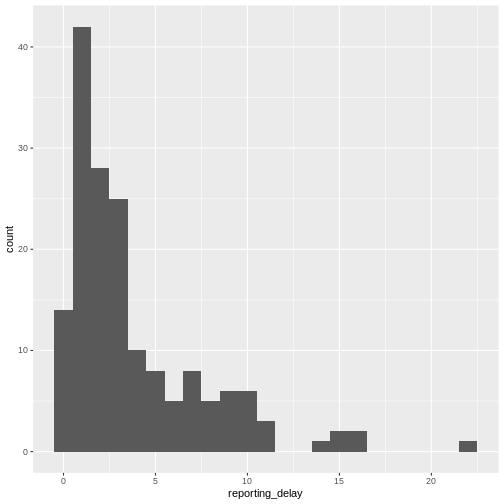
Figure 5
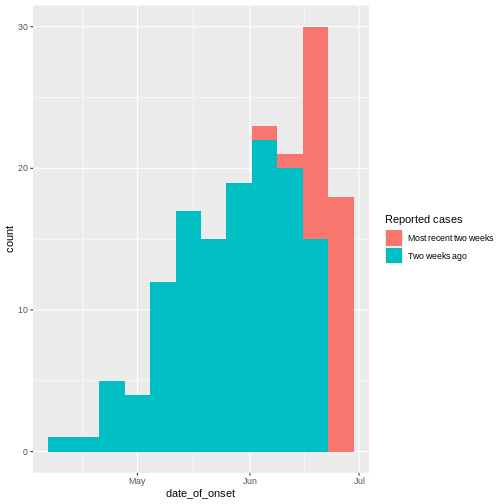
Figure 6
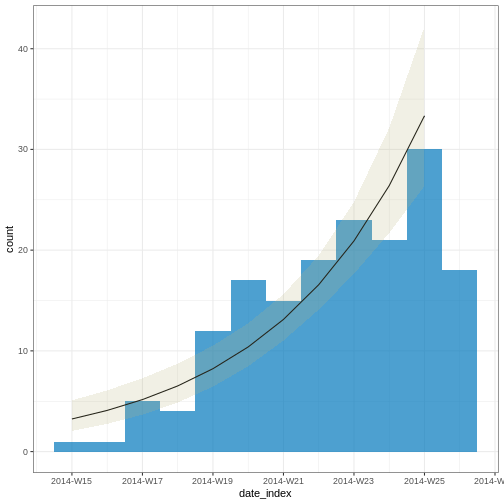
Figure 7
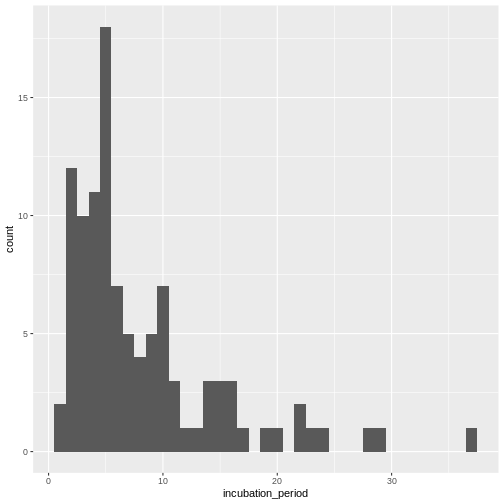
Introduction to delays
Figure 1
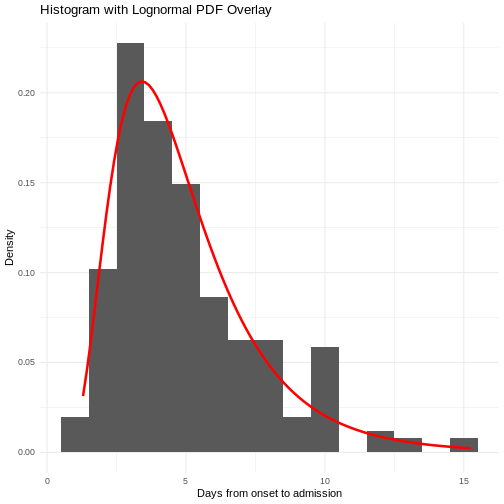
Figure 2
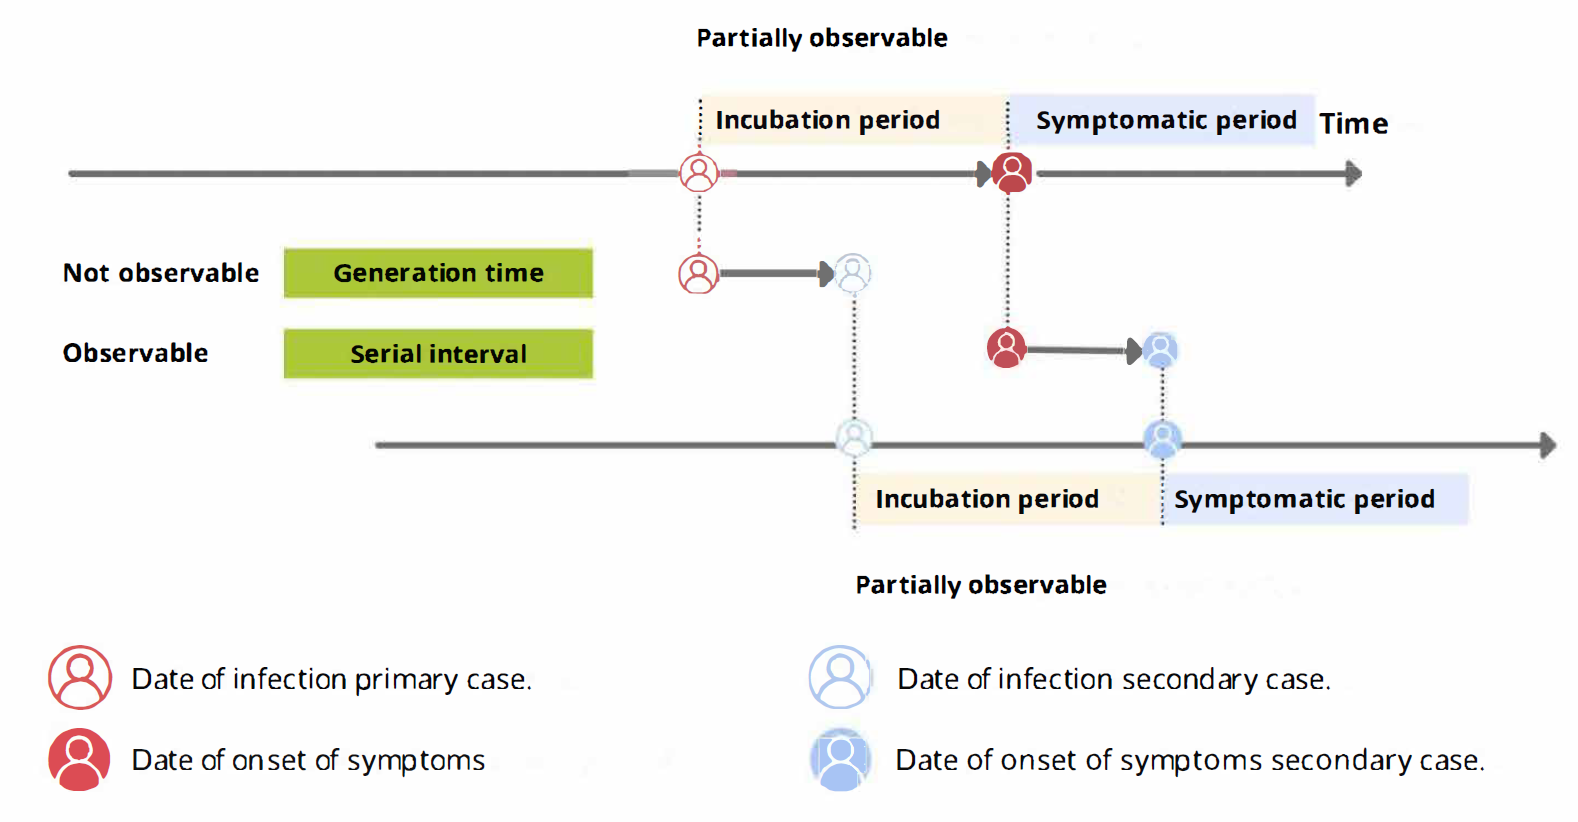
A schematic of the relationship of different
time periods of transmission between a primary case and a secondary case
in a transmission pair. Adapted from Zhao
et al, 2021
Figure 3
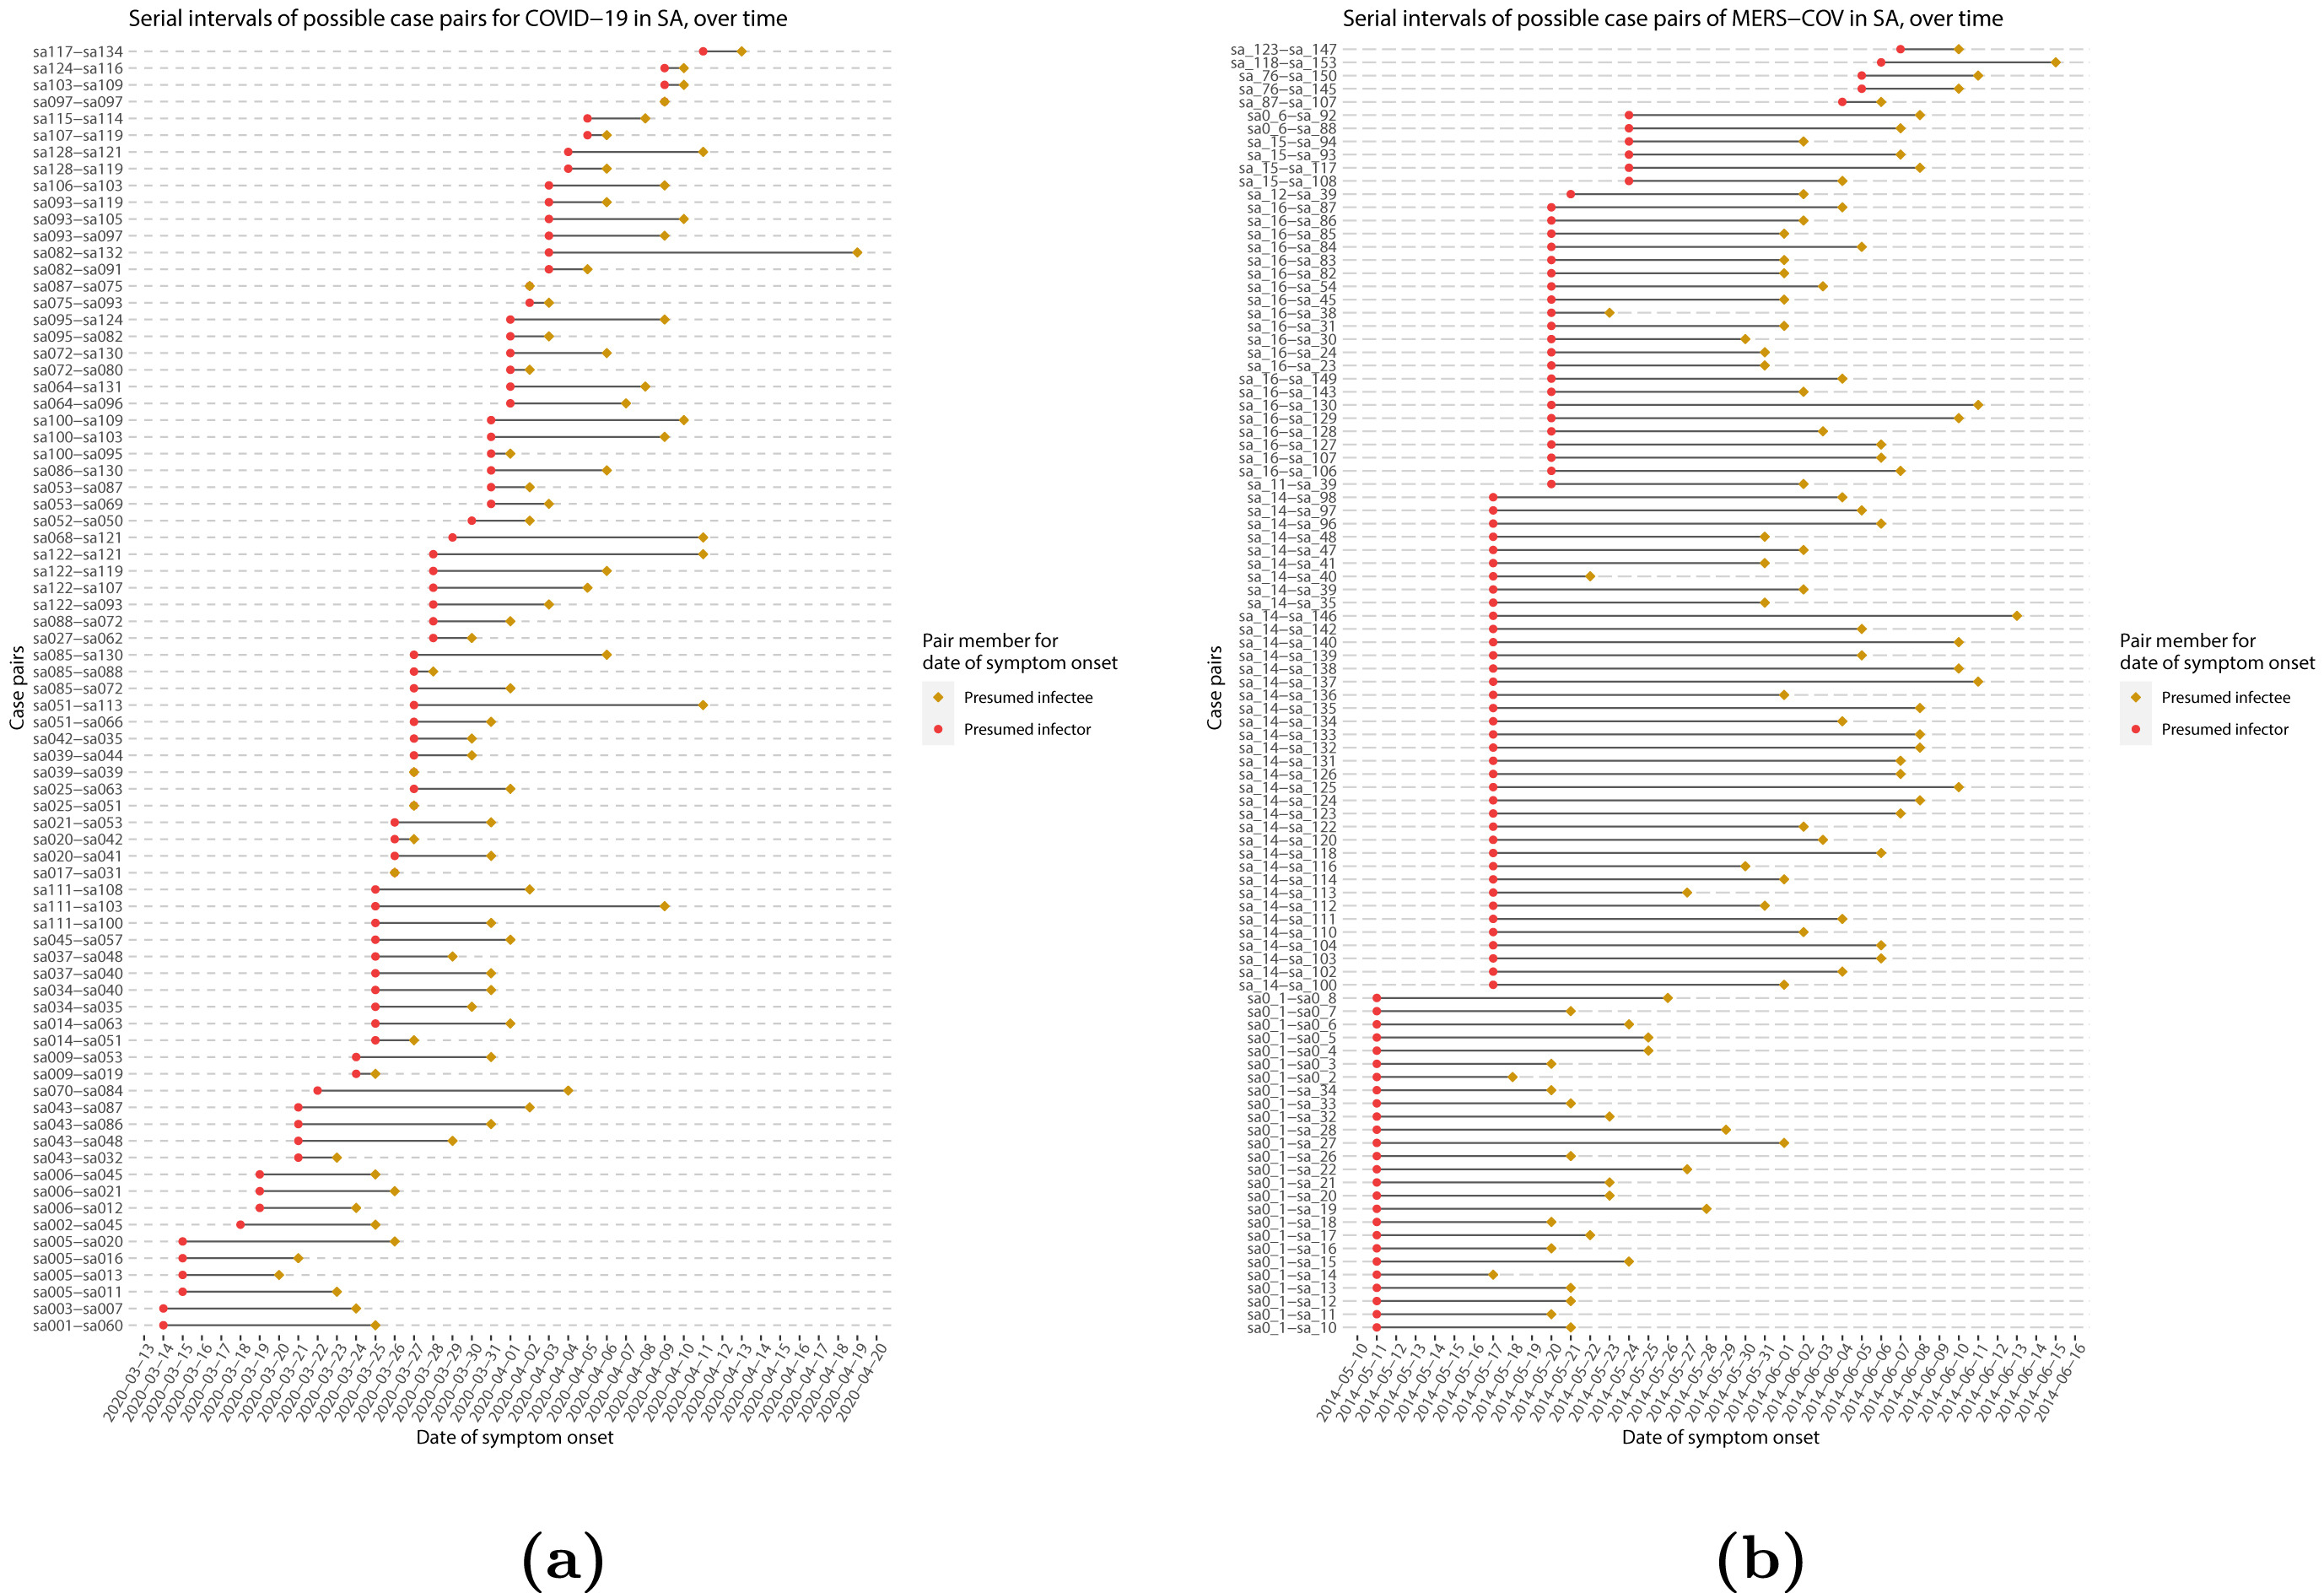
Serial intervals of possible case pairs in (a)
COVID-19 and (b) MERS-CoV. Pairs represent a presumed infector and their
presumed infectee plotted by date of symptom onset (Althobaity
et al., 2022).
Figure 4
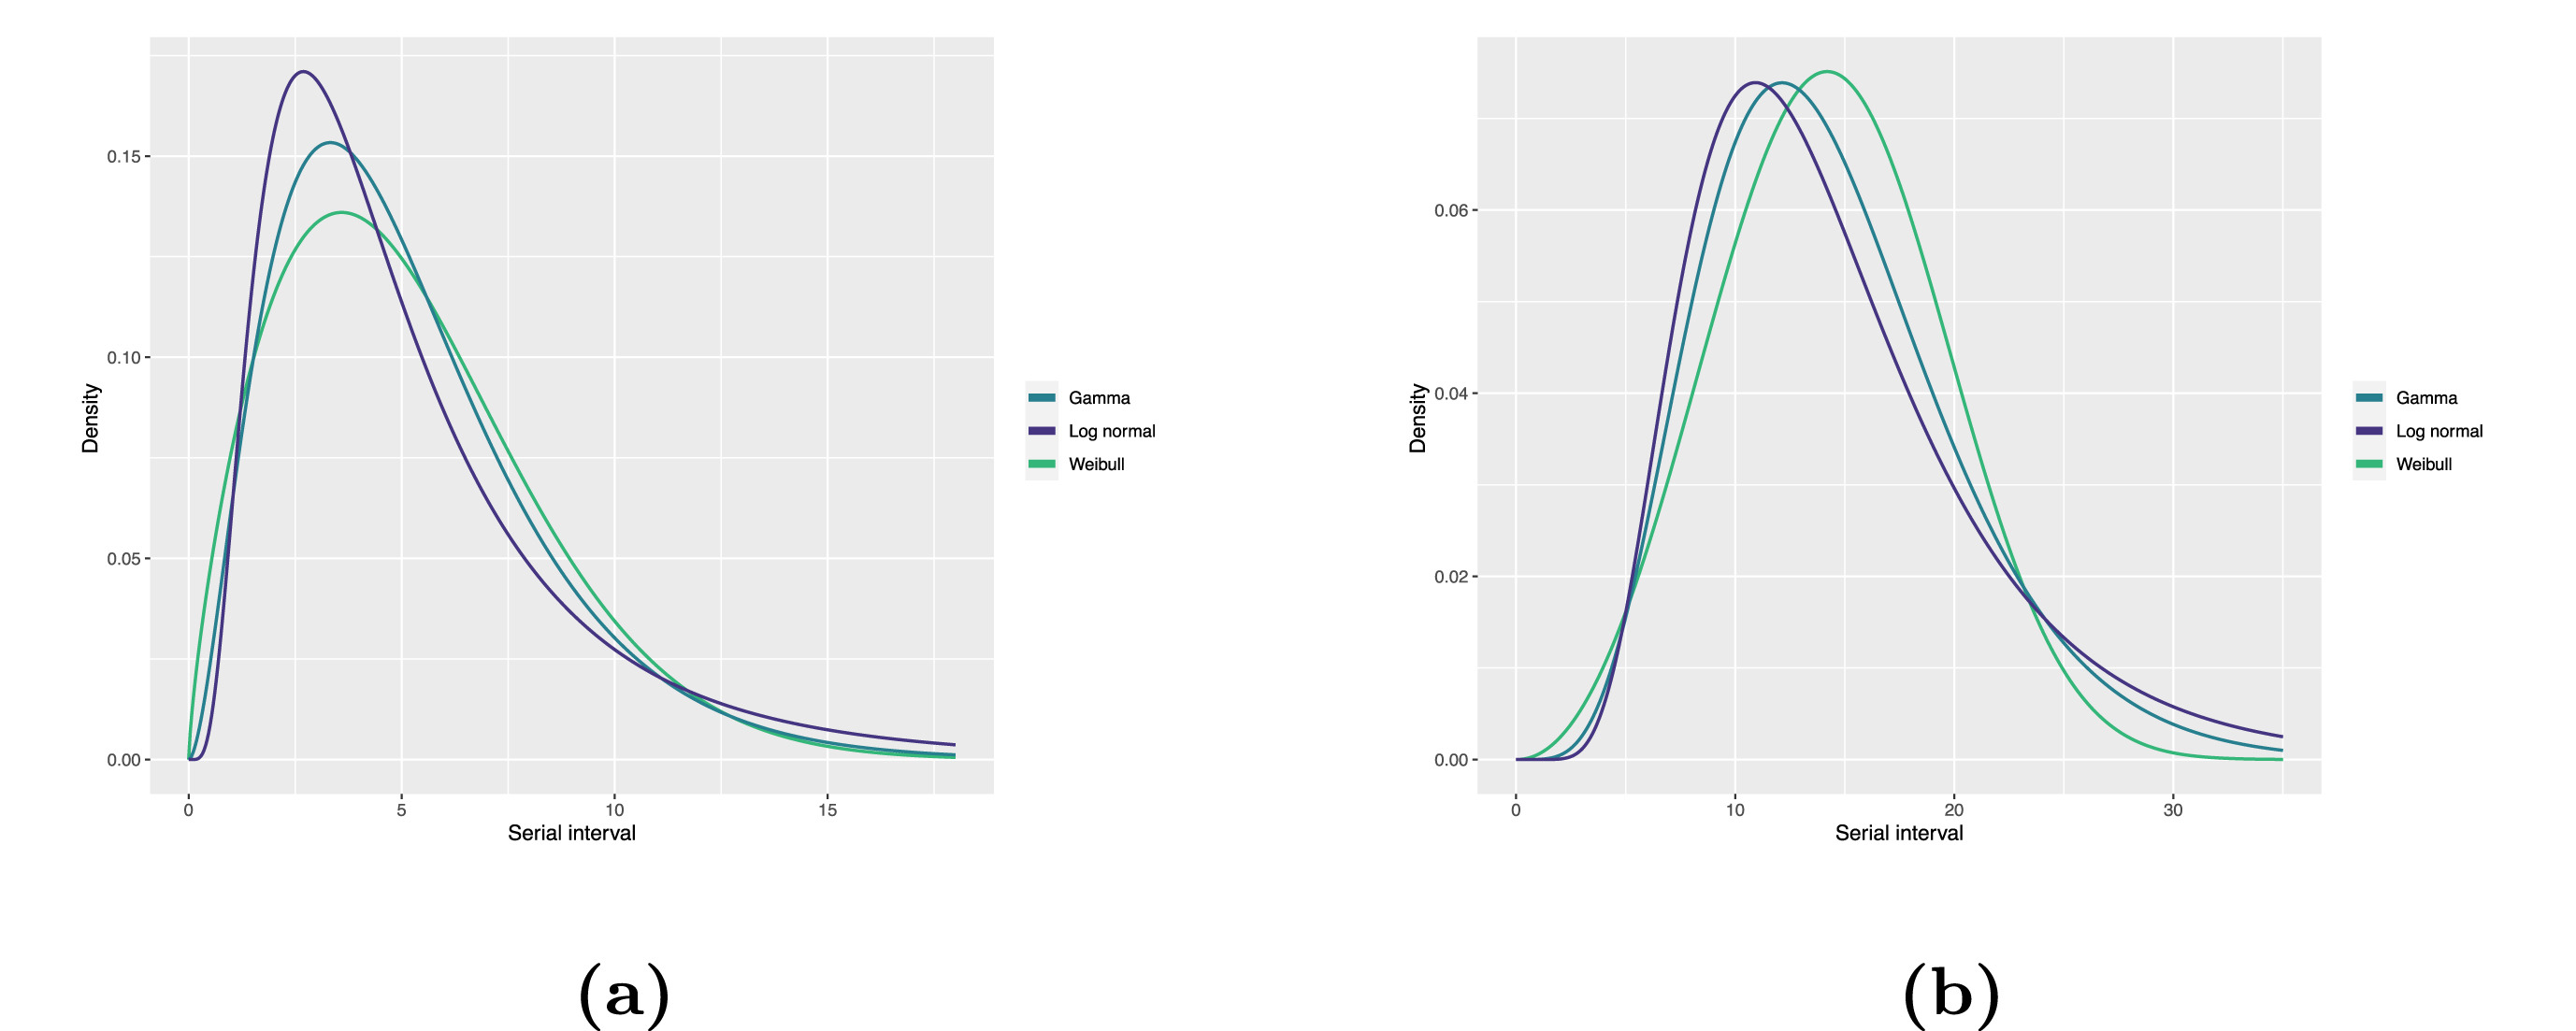
Fitted serial interval distribution for (a)
COVID-19 and (b) MERS-CoV based on reported transmission pairs in Saudi
Arabia. We fitted three commonly used distributions, Log normal, Gamma,
and Weibull distributions, respectively (Althobaity
et al., 2022).
Figure 5
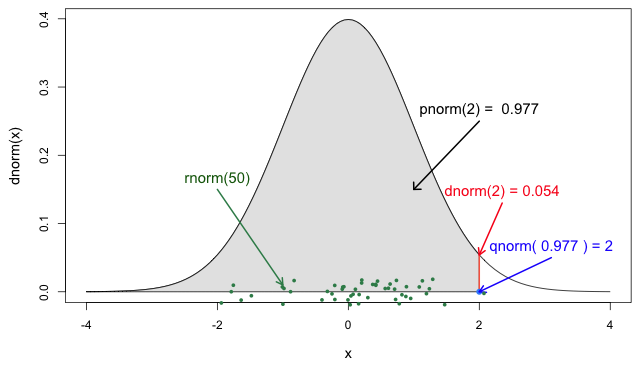
The four probability functions for the normal
distribution (Jack
Weiss, 2012)
Figure 6
