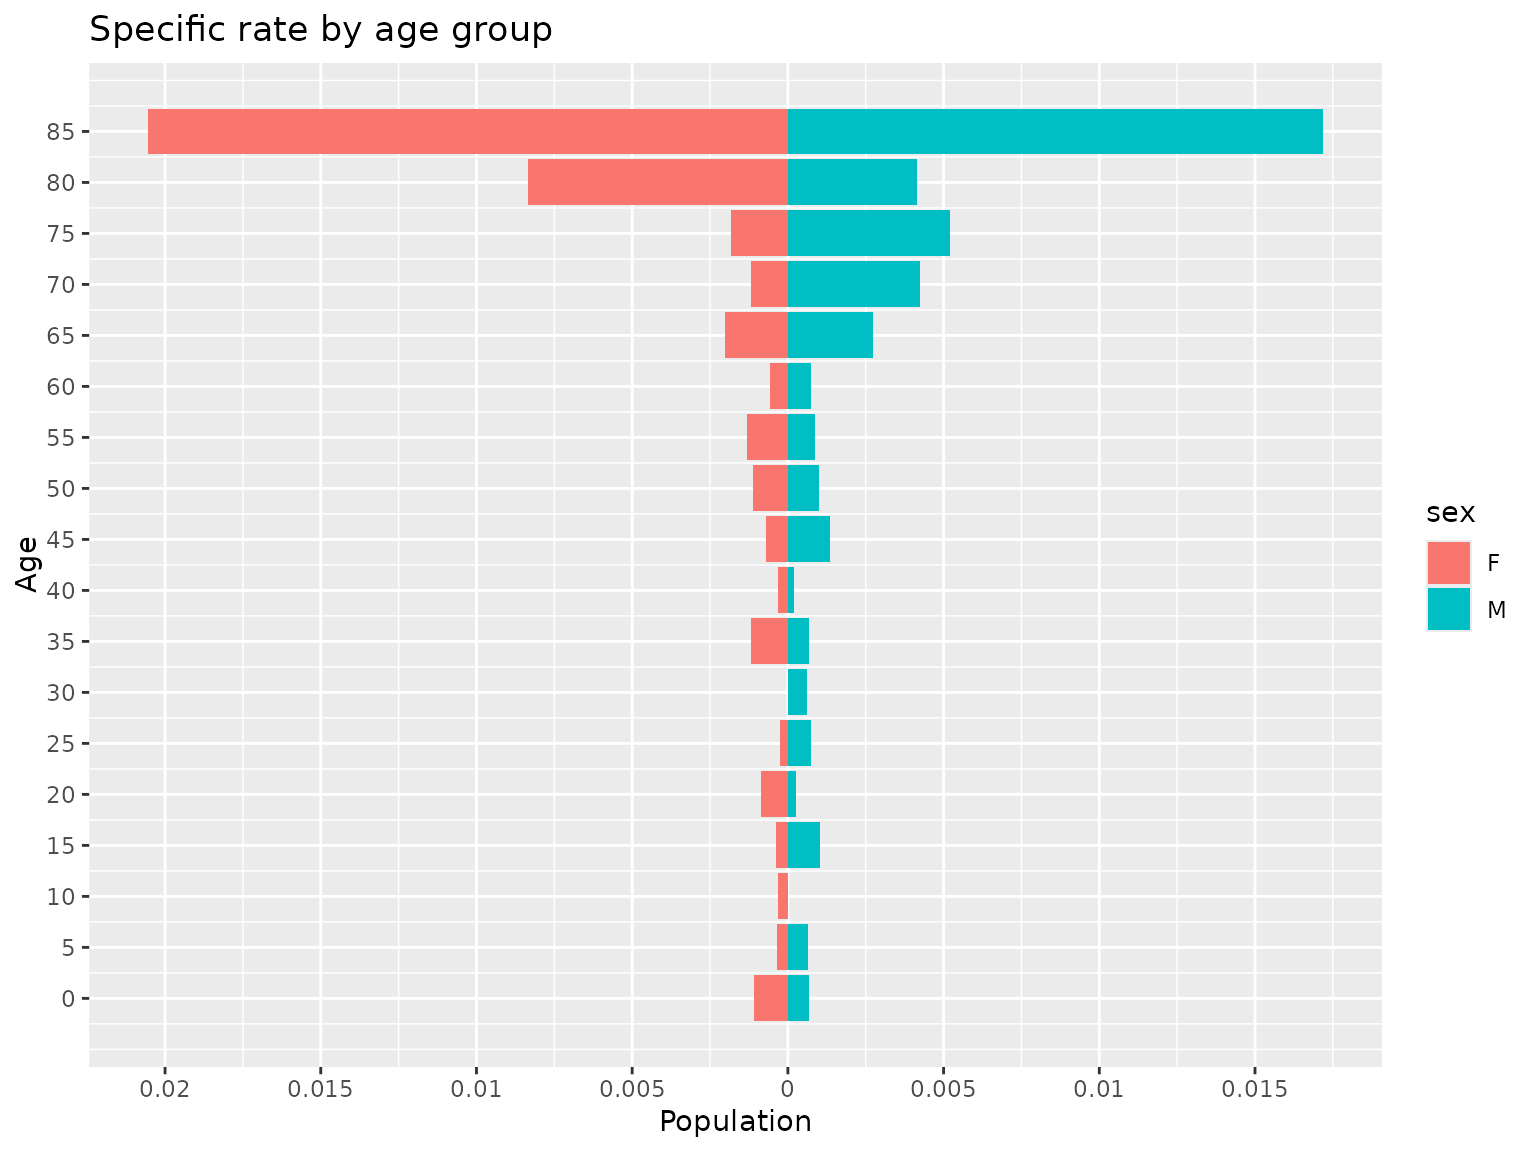
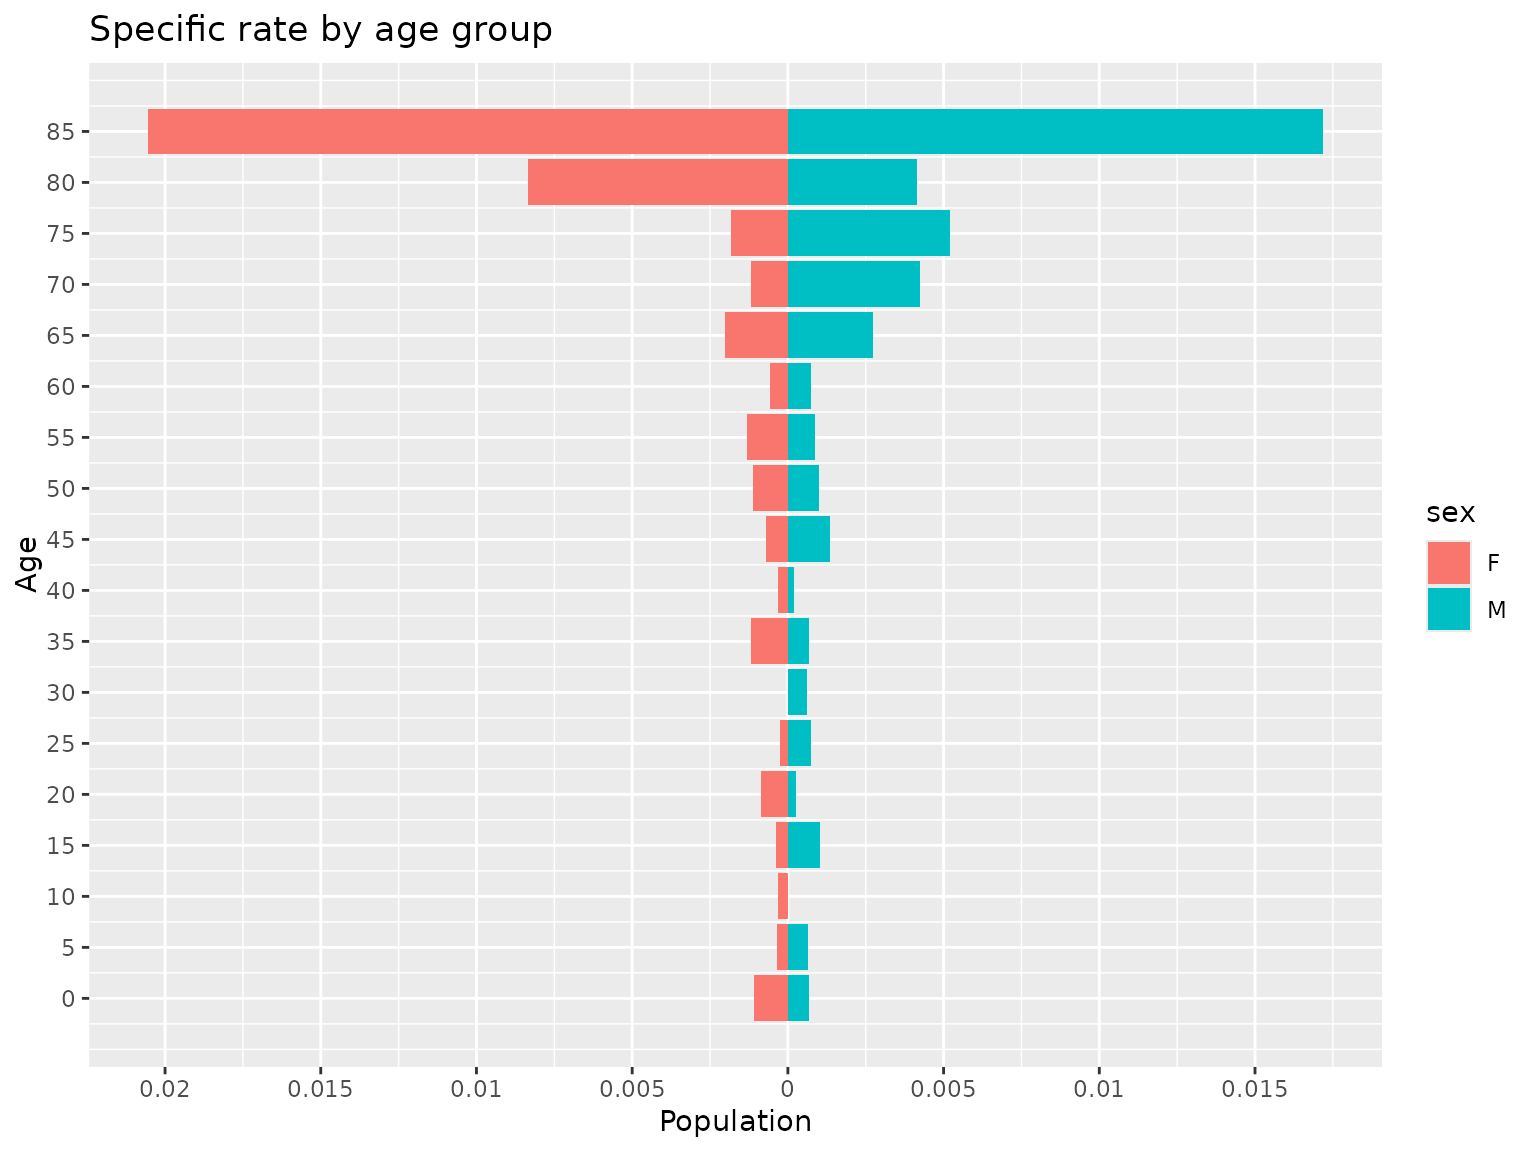
Returns the specific rates associated with being infected given age and sex
Source:R/demographics.R
age_risk.RdFunction that returns the specific rates of being infected given age and sex
Arguments
- age
A vector with the ages of cases in years from 0 to 100 years
- population_pyramid
A dataframe with the count of individuals with the columns age, population and sex
- sex
A vector with the sex of cases 'F' and 'M'. The default value is NULL
- plot
A boolean for displaying a plot. The default value is FALSE
Examples
pop_pyramid <- population_pyramid("15001", 2015,
  sex = TRUE, total = TRUE,
  plot = FALSE
)
ages <- round(runif(150, 0, 100))
sex <- c(rep("M", 70), rep("F", 80))
age_risk(
  age = ages, sex = sex, population_pyramid = pop_pyramid,
  plot = TRUE
)

#> $data
#>    age   population sex
#> 1    0 0.0010804970   F
#> 2    5 0.0003395586   F
#> 3   10 0.0003064195   F
#> 4   15 0.0003836317   F
#> 5   20 0.0008647313   F
#> 6   25 0.0002646203   F
#> 7   30 0.0000000000   F
#> 8   35 0.0011951001   F
#> 9   40 0.0003286771   F
#> 10  45 0.0007008936   F
#> 11  50 0.0011312217   F
#> 12  55 0.0013166557   F
#> 13  60 0.0005640158   F
#> 14  65 0.0020128824   F
#> 15  70 0.0011976048   F
#> 16  75 0.0018198362   F
#> 17  80 0.0083333333   F
#> 18  85 0.0205479452   F
#> 19   0 0.0006817794   M
#> 20   5 0.0006358290   M
#> 21  10 0.0000000000   M
#> 22  15 0.0010361352   M
#> 23  20 0.0002606542   M
#> 24  25 0.0007267442   M
#> 25  30 0.0006292276   M
#> 26  35 0.0006902502   M
#> 27  40 0.0002013693   M
#> 28  45 0.0013608528   M
#> 29  50 0.0010095911   M
#> 30  55 0.0008815751   M
#> 31  60 0.0007513148   M
#> 32  65 0.0027487631   M
#> 33  70 0.0042265427   M
#> 34  75 0.0052015605   M
#> 35  80 0.0041407867   M
#> 36  85 0.0171990172   M
#>
#> $plot

#>
#>