Modelling leaky vaccination and hospitalisation outcomes with Vacamole
Source:vignettes/model_vacamole.Rmd
model_vacamole.RmdNew to epidemics? It may help to read the “Get started” and “Modelling a vaccination campaign” vignettes first!
Vacamole is a deterministic, compartmental epidemic model built by Kylie Ainslie and others at RIVM, the Dutch Public Health Institute for the Covid-19 pandemic, with a focus on scenario modelling for hospitalisation and vaccination (Ainslie et al. 2022).
Vacamole was implemented as an R package, and the source code can be found on GitHub. Some versions have been used to generate scenarios for the ECDC Covid-19 Scenario Hub.
The original model has 8 conceptual compartments - four epidemiological compartments: susceptible, exposed, infectious, and recovered (S, E, I, R respectively), three hospitalisation compartments: hospitalised, in intensive care, and returning from intensive care to regular hospital care (H, ICU, ICU2H), and death. Only infected individuals can enter the hospitalisation or death compartments.
Individuals from the susceptible compartment may be vaccinated partially () or fully (; assuming a two dose regimen), with each dose reducing their probability of being infected, and of being hospitalised or dying.
Modifications for epidemics
We have made some modifications to the ODE model of Vacamole in order to make it more general and thus potentially more applicable to a wider range of settings.
Specifically,
We have dropped the ICU and ICU2H compartment as this is potentially less relevant to a context in which intensive care capacity is low.
We have added transitions from the infectious (I) and hospitalised (H) compartments to death (D), as this may be a more general assumption when hospital capacity is low (relatively more I → D) or when treatments are poor (relatively more H → D).
-
We assume, in a first pass implementation that vaccination primarily reduces adverse outcomes, by modification to the transition rates ():
: The transmission rate for individuals in the fully vaccinated compartment ;
: The hospitalisation rate for fully vaccinated, infected individuals ( → );
: The mortality rate for all fully vaccinated individuals at any stage in or post infection (I, or H).
The details of the ODE system for the version of Vacamole included in epidemics can be found at the end of this page.
Prepare population and initial conditions
Prepare population and contact data.
# load contact and population data from socialmixr::polymod
polymod <- socialmixr::polymod

# demography data from the wpp2024 package
data("popAge1dt", package = "wpp2024")
uk_pop <- popAge1dt |>
  dplyr::filter(name == "United Kingdom", year == 2006) |>
  dplyr::select(lower.age.limit = age, population = pop) |>
  dplyr::mutate(population = population * 1000)

contact_data <- socialmixr::contact_matrix(
  polymod,
  countries = "United Kingdom",
  survey_pop = uk_pop,
  age_limits = c(0, 20, 65),
  symmetric = TRUE,
  return_demography = TRUE
)

# prepare contact matrix
contact_matrix <- contact_data[["matrix"]]

# prepare the demography vector
demography_vector <- contact_data$demography$population
names(demography_vector) <- colnames(contact_matrix)
Prepare initial conditions for each age group. The Vacamole model has 11 compartments and therefore requires a matrix with 11 columns.
# initial conditions
initial_i <- 1e-6

# // 0| 1| 2|3| 4|5| 6|7| 8|9|10
# // S|V1|V2|E|EV|I|IV|H|HV|D|R

# make initial conditions - order is important
initial_conditions <- c(
  S = 1 - initial_i,
  V1 = 0, V2 = 0,
  E = 0, EV = 0,
  I = initial_i, IV = 0,
  H = 0, HV = 0, D = 0, R = 0
)
initial_conditions <- rbind(
  initial_conditions,
  initial_conditions,
  initial_conditions
)

# assign rownames for clarity
rownames(initial_conditions) <- rownames(contact_matrix)
Prepare the time in days over which to model the epidemic, with the outbreak beginning at day zero.
epidemic_days <- 300Prepare a population as a population class object.
uk_population <- population(
  name = "UK",
  contact_matrix = contact_matrix,
  demography_vector = demography_vector,
  initial_conditions = initial_conditions
)
Prepare a two dose vaccination campaign
We prepare a two-dose vaccination campaign by concatenating two
single dose vaccination regimes, i.e., applying the function
c() to two vaccination objects.
It is possible to combine multiple vaccination objects together using
c() — the only limitation is that all vaccination regimes
combined in this way must have the same number of demographic groups. It
is possible to add a single dose to a two-vaccination regime by using
c() on two vaccination objects with two and
one dose, respectively.
# prepare a two dose vaccination regime for a single age group
# prepare the first dose
dose_1 <- vaccination(
  name = "two-dose vaccination", # name given to first dose
  nu = matrix(1e-2, nrow = 3),
  time_begin = matrix(30, nrow = 3),
  time_end = matrix(epidemic_days, nrow = 3)
)

# prepare the second dose with a 30 day interval in start date
dose_2 <- vaccination(
  name = "two-dose vaccination", # name given to first dose
  nu = matrix(1e-2, nrow = 3),
  time_begin = matrix(60, nrow = 3),
  time_end = matrix(epidemic_days, nrow = 3)
)

# use `c()` to combine the two doses
double_vaccination <- c(dose_1, dose_2)

# print to visualise
double_vaccination
#>
#>  Vaccination name:
#>
#>  Begins at:
#>      dose_1 dose_2
#> [1,]     30     60
#> [2,]     30     60
#> [3,]     30     60
#>
#>  Ends at:
#>      dose_1 dose_2
#> [1,]    300    300
#> [2,]    300    300
#> [3,]    300    300
#>
#>  Vaccination rate:
#>      dose_1 dose_2
#> [1,]   0.01   0.01
#> [2,]   0.01   0.01
#> [3,]   0.01   0.01
Model epidemic using Vacamole
First, we run the model with no vaccination. This is the default behaviour, and a vaccination regime only need be specified if it is to be included. The model’s default parameters are:
Transmission rate (,
transmission_rate): 0.186, resulting from an = 1.3 and an infectious period of 7 days, given that .Infectiousness rate (,
infectiousness_rate): 0.5, assuming a pre-infectious period of 2 days, given that .Hospitalisation rate (,
hospitalisation_rate): 1.0 / 1000, assuming that one in every thousand infectious individuals is hospitalised.Mortality rate (,
mortality_rate): 1.0 / 1000, assuming that one in every thousand infectious and hospitalised individuals dies.Recovery rate (,
recovery_rate): 0.143, assuming an infectious period of 7 days, given .Susceptibility reduction from vaccination (
susc_reduction_vax): 0.2, assuming a 20% reduction in susceptibility for individuals who are doubly vaccinated.Hospitalisation reduction from vaccination (
hosp_reduction_vax): 0.2, assuming a 20% reduction in hospitalisation for individuals who are doubly vaccinated.Mortality reduction from vaccination (
mort_reduction_vax): 0.2, assuming a 20% reduction in mortality for individuals who are doubly vaccinated.
# note model will automatically account for no vaccination
data <- model_vacamole(
  population = uk_population,
  time_end = epidemic_days
)
Next we run the model with a two dose vaccination regime.
data_vaccination <- model_vacamole(
  population = uk_population,
  vaccination = double_vaccination, # note vaccination object for two doses
  time_end = epidemic_days
)
Visualise model outcomes
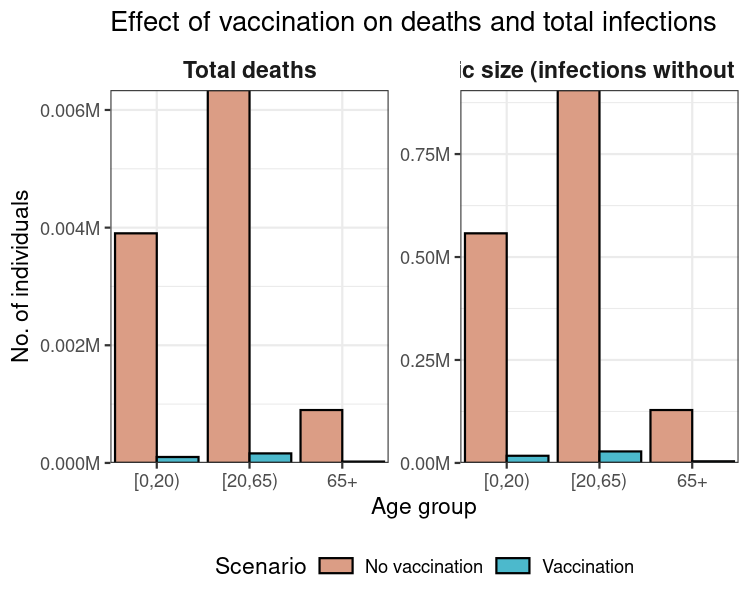
First, we calculate the total number of infections resulting in recoveries and deaths over the course of the simulation; this is the epidemic’s final size.
# collect data from the two scenarios
data_scenarios <- list(data, data_vaccination)

# get deaths and recoveries from infection
data_scenarios <- Map(
  data_scenarios, c("no_vax", "vax"),
  f = function(df, sc) {
    df_ <- distinct(df, demography_group)

    # get total deaths per group
    df_$total_deaths <- filter(
      df, time == max(time), compartment == "dead"
    ) |> pull(value)

    # get total recoveries per group using helper function `epidemic_size()`
    # do not count dead
    df_$total_recovered <- epidemic_size(df, include_deaths = FALSE)

    # add scenario information
    df_$scenario <- sc

    # return data
    df_
  }
)

# collect data
data_scenarios <- bind_rows(data_scenarios)

# transform to long format
data_scenarios <- pivot_longer(
  data_scenarios,
  cols = c("total_deaths", "total_recovered"),
  names_to = "measure"
)
ggplot(data_scenarios) +
  geom_col(
    aes(demography_group, value, fill = scenario),
    position = "dodge",
    colour = "black"
  ) +
  facet_wrap(
    facets = vars(measure),
    scales = "free_y",
    labeller = labeller(
      measure = c(
        total_deaths = "Total deaths",
        total_recovered = "Epidemic size (infections without deaths)"
      )
    )
  ) +
  scale_fill_discrete_qualitative(
    palette = "Dynamic",
    labels = c("No vaccination", "Vaccination"),
    name = "Scenario",
    na.value = "lightgrey"
  ) +
  scale_y_continuous(
    labels = label_comma(
      scale = 1e-6, suffix = "M"
    )
  ) +
  theme_bw() +
  theme(
    legend.position = "bottom",
    legend.key.height = unit(2, "mm"),
    strip.background = element_blank(),
    strip.text = element_text(
      face = "bold",
      size = 11
    )
  ) +
  expand_limits(
    x = c(0.5, length(unique(data_scenarios$demography_group)) + 0.5)
  ) +
  coord_cartesian(
    expand = FALSE
  ) +
  labs(
    x = "Age group",
    y = "No. of individuals",
    title = "Effect of vaccination on deaths and total infections"
  )
Finally, we can compare the peak of hospital bed occupancy in each scenario — this can be a rough indication of how much hospital capacity would be required if a pandemic of these characteristics were to occur, as well as another way to examine the effect of vaccination in reducing this requirement.
# collect data from the two scenarios
data_scenarios <- list(data, data_vaccination)

peak_hospital_occupancy <- vapply(data_scenarios, function(df) {
  # get highest hospital occupancy
  # first get total hospitalisations among vaccinated and un- or part-vacc.
  df <- filter(
    df,
    grepl(
      pattern = "hospitalised", x = compartment,
      fixed = TRUE
    )
  ) |>
    # summarise all hospitalised over time, aggregating away age groups
    summarise(
      total_hosp = sum(value), .by = "time"
    ) |>
    # filter for the time point with highest hospital occupancy
    filter(total_hosp == max(total_hosp)) |>
    # get the value
    pull(total_hosp)
}, FUN.VALUE = numeric(1))

# set names for comprehensibility
names(peak_hospital_occupancy) <- c("No vaccination", "Vaccination")

# show peak hospital occupancy in a readable format
format(peak_hospital_occupancy, big.mark = ",", digits = 1)
#> No vaccination    Vaccination
#>        "1,841"        "   12"
This example demonstrates that implementing vaccination can substantially reduce peak hospital occupancy (by about 99%) compared to a scenario in which no vaccines are deployed.
Vacamole ODE system for {epidemics}
The Vacamole ODE system adapted for {epidemics} is:
Susceptibles who are not vaccinated, or only partially vaccinated (considered unprotected) can transition to exposed and vaccinated:
Two sequential vaccination compartments, with a lower conversion rate from two-dose vaccinated individuals (considered to be protected) to exposed:
Two parallel exposed compartments, with similar conversion to infectious:
Two parallel infectious compartments, with lower hospitalisation and mortality rate for vaccinated:
Two parallel hospitalisation compartments, with a lower mortality rate for vaccinated:
Single recovered compartment:
Single mortality compartment: